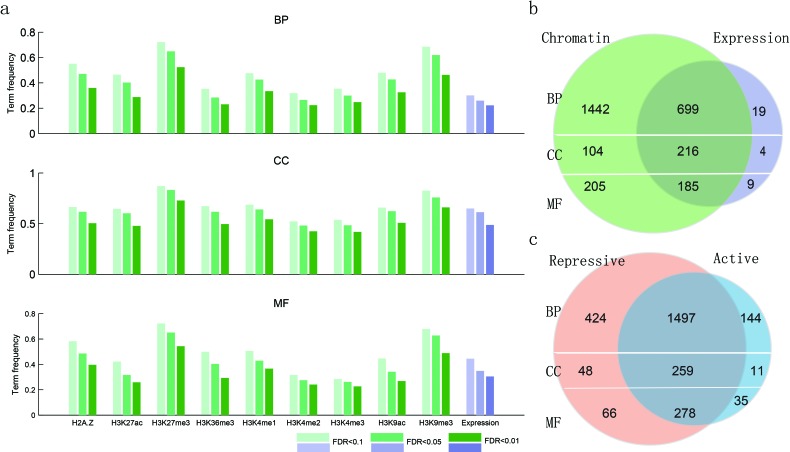
Figure 2. Functionally similar genes have epigenetic and transcriptional similarities.
a., the proportion of GO terms with epigenetic and transcriptional similarities. b., venn diagram showing the number of GO terms with chromatin and expression similarities. c., venn diagram showing the number of GO terms with chromatin similarities, with the chromatin states divided into active and repressive based on their effects on gene expression.

