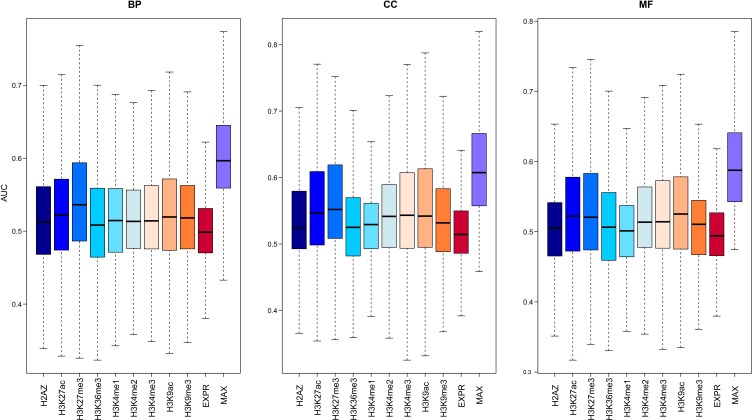
Figure 3. The predictive power of the model using signals from different chromatin or expression features.
For each GO term, 100 GSNs with the same number of genes as GSPs were randomly selected from the remaining genes, and then cross-validation was used to compute the AUC. The average AUCs for 100 times of all GO terms are shown in the boxplot. The left panel is for biological process (BP) categories, middle panel for cell component (CC) categories and the right panel for molecular function (MF) categories.

