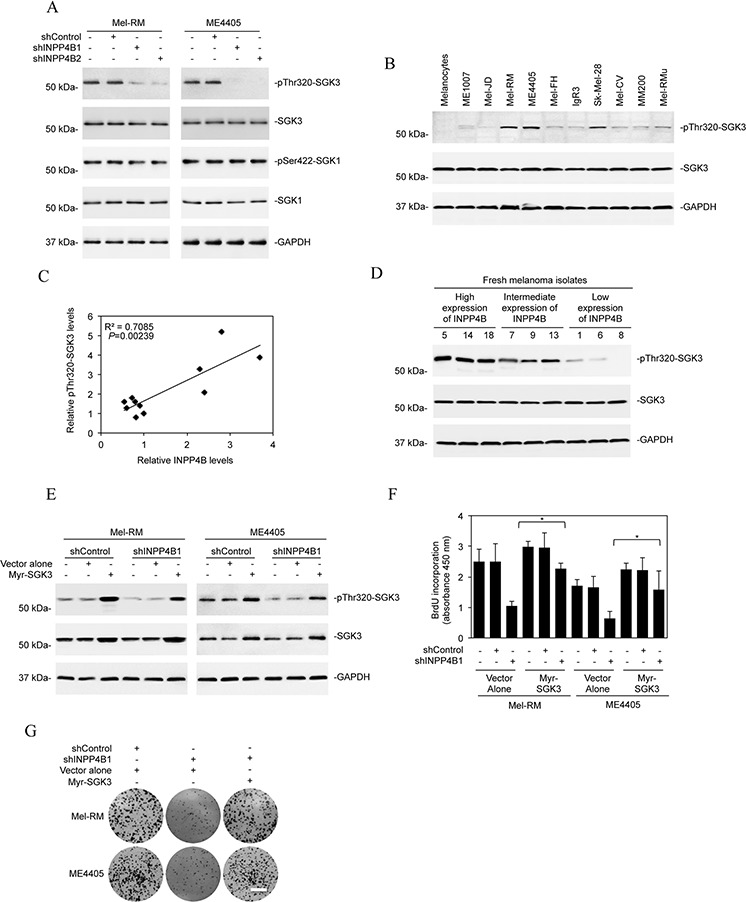
Figure 3. SGK3 is involved in INPP4B-mediated melanoma cell proliferation.

A. Whole cell lysates from Mel-RM and ME4405 cells stably transduced with the control shRNA (shControl) or INPP4B shRNA1 (shINPP4B1) were subjected to Western blot analysis of phosphorylated SGK3 (pThr320-SGK3), SGK3, phosphorylated SGK1 (pSer422-SGK1), SGK1, and GAPDH (as a loading control). The data shown are representative of three Western blot analyses. B. Whole cell lysates from the panel of melanoma cells lines and pooled melanocytes of three different lines (HEMa-LP, HEMn-MP and HEMn-DP) as shown in Figure 1D were subjected to Western blot analysis of phosphorylated SGK3 (pThr320-SGK3), SGK3 and GAPDH (as a loading control). The data shown are representative of three individual experiments. C. Regression analysis of the relationship between the levels of INPP4B expression as shown in Figure 1D and SGK3 activation as shown in Figure 3B. D. Whole-cell lysates from fresh melanoma isolates with relatively low, intermediate, and high levels of INPP4B were subjected to Western blot analysis of phosphorylated SGK3 (pThr320-SGK3), SGK3 and GAPDH (as a loading control). The data shown are representative of three individual Western blot analyses. E. Mel-RM and ME4405 cells stably transduced with the control shRNA (shControl) or INPP4B shRNA1 (shINPP4B1) were transduced with the vector alone or myr-SGK3 cDNA. Whole cell lysates were subjected to Western blot analysis of phosphorylated SGK3 (pThr320-SGK3), SGK3 and GAPDH (as a loading control). The data shown are representative of three individual Western blot analyses. F. Mel-RM and ME4405 cells stably transduced with the control shRNA (shControl) or INPP4B shRNA1 (shINPP4B1) were transduced with the vector alone or myr-SGK3 cDNA. Cells were subjected to BrdU incorporation assays. The data are mean ± SEM of three individual experiments. *P < 0.05, Student's t-test. G. Mel-RM and ME4405 cells stably transduced with the control shRNA (shControl) or INPP4B shRNA1 (shINPP4B1) were transduced with the vector alone or myr-SGK3 cDNA. Cells were subjected to clonogenic assays. The data shown are representative of three individual clonogenic assays. Scale bar, 1cm.
