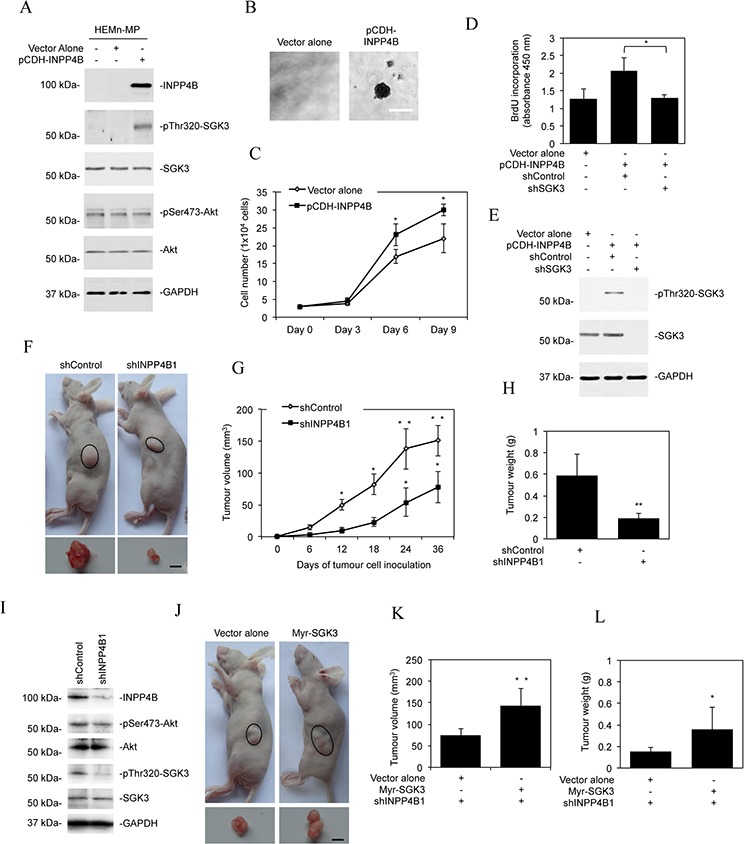
Figure 4. INPP4B promotes melanoma growth.

A. Whole cell lysates from HEMn-MP melanocytes stably transduced with the vector alone or INPP4B cDNA cloned in the pCDH vector (pCDH-INPP4B) were subjected to Western blot analysis of INPP4B, phosphorylated SGK3 (pThr320-SGK3), SGK3, phosphorylated Akt (pSer473-Akt), Akt and GAPDH (as a loading control). The data shown are representative of three individual Western blot analyses. B. Representative microphotographs of anchorage-independent growth of HEMn-MP melanocytes transduced with INPP4B cDNA cloned in the pCDH vector (pCDH-INPP4B). The data shown are representative of three individual clonogenic assays. Scale bar, 0.5 mm. C. Comparison of numbers of HEMn-MP melanocytes on day 3, 6, and 9 after being transduced with the vector alone or pCDH-INPP4B. The data shown are mean ± SEM of three individual experiments. *P < 0.05, Student's t-test. D. HEMn-MP melanocytes transduced with the vector alone or pCDH-INPP4B were transduced with the control shRNA (shControl) or SGK3 shRNA (shSGK3). Forty-eight hours later, cells were subjected to BrdU incorporation assays. The data shown are mean ± SEM of three individual experiments. *P < 0.05, Student's t-test. E. HEMn-MP melanocytes transduced with the or pCDH-INPP4B were transduced with the control shRNA (shControl) or SGK3 shRNA (shSGK3). Forty-eight hours later, whole-cell lysates were subjected to Western blot analysis of phosphorylated SGK3 (pThr320-SGK3), SGK3 and GAPDH (as a loading control). The data shown are representative of three individual experiments. F. Representative photographs showing that xenografts of Mel-RM cells transduced with the INPP4B shRNA1 (shINPP4B1) are smaller than those with the control shRNA (shControl) (n = 8). Scale bar, 5 mm. G. Comparison of growth curves of xenografts of Mel-RM cells transduced with the INPP4B shRNA1 (shINPP4B1) and those with the control shRNA (shControl). The data shown are mean ± SEM, n = 8. **P < 0.01, *P < 0.05 Student's t-test. H. Comparison of weight of harvested xenografts of Mel-RM cells transduced with the INPP4B shRNA1 (shINPP4B1) and those with the control shRNA (shControl). The data shown are mean ± SEM, n = 8. **P < 0.01, Student's t-test. I. Whole cell lysates of crude tumour tissues from representative harvested xenografts of Mel-RM cells transduced with the INPP4B shRNA1 (shINPP4B1) and those with the control shRNA (shControl) were subjected to Western blot analysis of INPP4B, phosphorylated Akt (pSer473-Akt), Akt, phosphorylated SGK3 (pThr320-SGK3), SGK3 and GAPDH (as a loading control). The data shown are representative of three individual Western blot analyses. J. Representative photographs showing that xenografts of Mel-RM cells transduced with the INPP4B shRNA1 (shINPP4B1) co-introduced with the cDNA encoding myr-SGK3 are larger than those co-introduced with the vector alone. (n = 8). Scale bar, 5 mm. K. Comparison of growth curves of xenografts of Mel-RM cells transduced with the INPP4B shRNA1 (shINPP4B1) co-introduced with the cDNA encoding myr-SGK3 and those co-introduced with the vector alone. The data shown are mean ± SEM, n = 8. **P < 0.01, Student's t-test. L. Comparison of weight of harvested xenografts of Mel-RM cells transduced with the INPP4B shRNA1 (shINPP4B1) co-introduced with cDNA encoding myr-SGK3 and those co-introduced with the vector alone. The data shown are mean ± SEM, n = 8. *P < 0.05, Student's t-test.
