
Figure 3. Consequences of eIF4H overexpression in NIH3T3 cells.
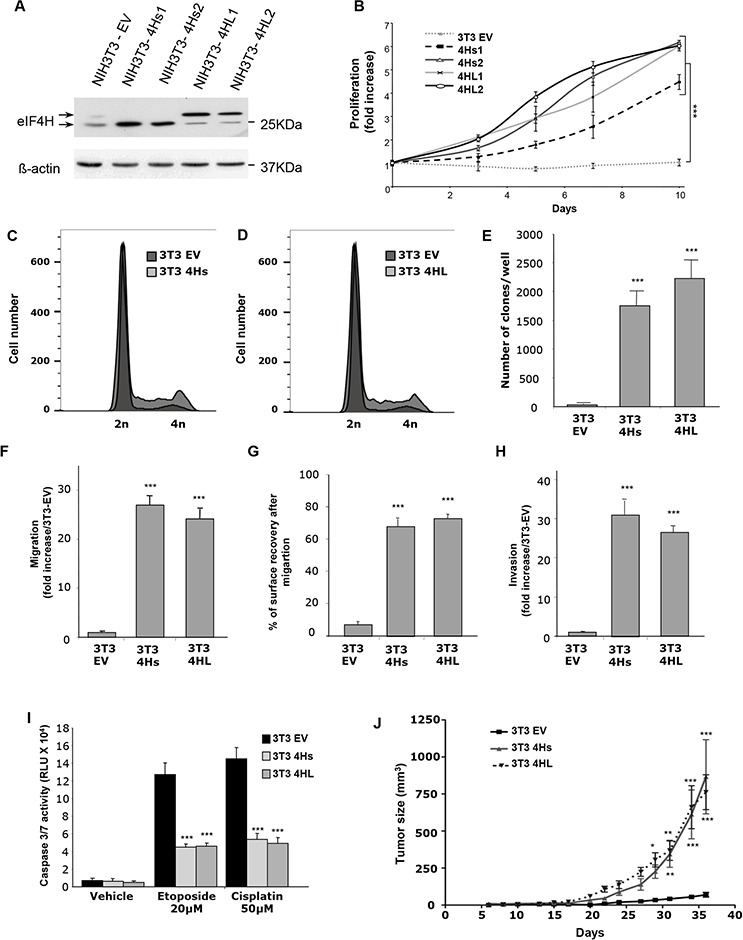
A. Expression analysis of eIF4H short isoforms (4Hs1 and 4Hs2) and long isoforms (4HL1 and 4HL2) transfected into NIH3T3 stable clones. The control was provided by NIH3T3 cells stably transfected with the empty vector (3T3 EV). Loading was normalized to β-actin. B. Proliferation of NIH3T3 stable clones overexpressing short (4Hs1 and 4Hs2) or long (4HL1 and 4HL2) eIF4H isoforms under low serum conditions (1%) for 10 days. C. and D. Cell cycle analysis of NIH3T3 stable clones overexpressing short (4Hs) (C) or long (4HL) (D) eIF4H isoforms under low serum conditions was carried out using flow cytometry. E. Colony formation of eIF4H-transfected NIH3T3 cell lines in soft agar. The number of clones in agar was determined after 25 days. F. Cell migration quantification of NIH3T3 stable clones in a Boyden chamber assay after 6 hours. The number of migrating cells was calculated by integrating 12 independent cellular fields (from 3 independent assays). G. Cell migration after wound breakage of a monolayer of NIH3T3 stable clones was determined by a cell restitution assay. Migration was quantified as the percentage of surface recovery after 8 hours. H. Invasive properties of NIH3T3 stable clones using an invasion chamber assay. After 24 hours incubation the invasive cell number was determined by crystal violet staining. Quantification of data was performed as in (E). I. Caspase 3/7 activity after 8 hours treatment with etoposide (20 μM) or cisplatin (50 μM) of control NIH3T3 cells or cells expressing the eIF4H isoforms. J. Tumorigenicity of NIH3T3 cells expressing the eIF4H isoforms. Tumor volumes were measured at the indicated time points after subcutaneous injection of NIH3T3 stable clones into 9 nude mice in each group. Error bars show SEM.