
Figure 4. Effect of eIF4H on cap- and IRES-dependent translation.
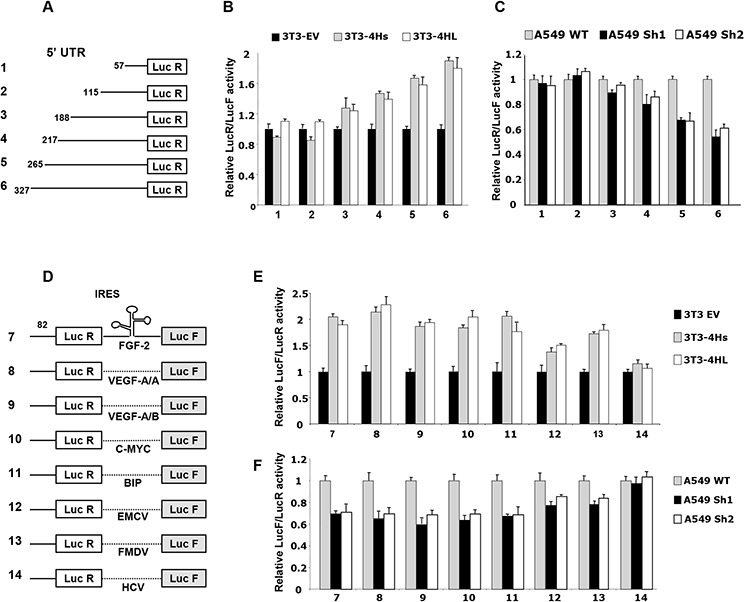
A. Schematic representation of monocistronic constructs with different 5′UTR lengths. B. Ratio of luminescence from the experimental reporter (Renilla) to the control reporter (Firefly; PGL3 from Promega) after co-transfection of NIH3T3 cells expressing the short (4Hs) or long (4HL) eIF4H isoforms, normalized to NIH3T3 empty vector control cells (set as 1). C. Ratio of luminescence from the experimental reporter (Renilla) to the control reporter (Firefly; PGL3 from Promega) after co-transfection of A549 eIF4H knockdown cells (sh1 and sh2), normalized to the A549 scramble control cells (set as 1). D. Schematic representation of bicistronic constructs. IRESs cloned within the inter-cistronic region were either viral (EMCV, FMDV, HCV) or cellular (FGF-2, VEGF-A IRESA, VEGF-A IRESB, C-MYC and BIP). E. Ratio of luminescence from the IRES-dependent reporter (Firefly) to the cap-dependent reporter (Renilla) in NIH3T3 cells expressing the short (4Hs) or long (4HL) eIF4H isoforms, normalized to the NIH3T3 empty vector control cells (set as 1). F. Ratio of Firefly to Renilla luminescence in A549 eIF4H knockdown cells (sh1 and sh2), normalized to the A549 scramble control cells (set as 1).