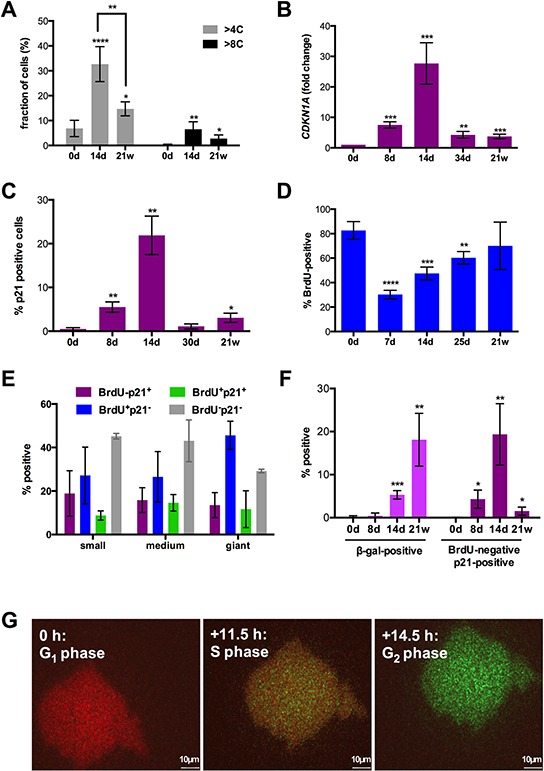
Figure 2. Cell cycle parameters after CPT treatment of SKOV3 cells.

A. Fraction of cells with a para-diploid (≤4C) or polyploid (>4C) DNA content at different times of CPT treatment determined by flow cytometry analysis after propidium iodide staining (sample size: n = 3). A corresponding histogram is shown in Figure S2. B. Quantitation of CDKN1A mRNA expression by RT-qPCR. C, D. Fractions of cells expressing p21 protein or incorporating BrdU visualized by immunofluorescence at the indicated times and microscopically quantified (sample size: n = 3). E. Fraction of small, medium and giant cells negative or positive for p21 expression and BrdU incorporation on day 14 (microscopic quantification; sample size: n = 3). F. Fraction of cells positive for β-galactosidase activity (X-Gal; left panel) or BrdU-negative and p21-positive (right panel; microscopic quantification; sample size: n = 3). G. SKOV3 cells on day 14 of CPT treatment infected with a baculovirus-derived vector expressing FUCCI cell cycle sensors. The Figure shows images of the same cell from a video obtained by life cell imaging at intervals of 11.5 (S) and 14.5 hours (G2) relative to the first image (G1).
