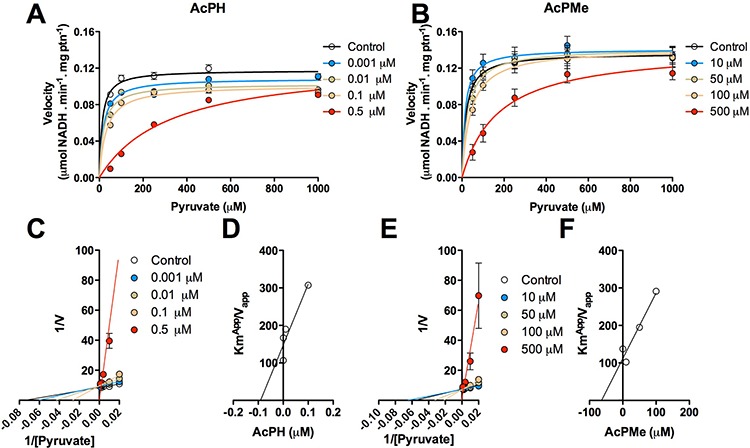
Figure 4. Kinetics of inhibition of PDHC by AcPH and AcPMe in alamethicin-permeabilized mitochondria from rat skeletal muscle.

The reaction was started by addition of mitochondria. Michaelis-Menten plots show the dependence of PDHC activity on pyruvate (50, 100, 250, 500, 1000 μM) at different concentrations of AcPH (A) and AcPMe (B) Each inhibitor was loaded into separate 96 well plates. Endogenous calibration curves to measure the NADH reduction in each of the plates were used. Variation in the control Vmax values between different plates, preparations and/or permeabilization of mitochondria was insignificant (within 10%). Double-reciprocal plots of the data presented in (A) and (B) reveal competition between pyruvate and AcPH (C) or AcPMe (E). for binding to PDHC. Secondary inhibition plots were built to determine Ki for AcPH (D) and AcPMe (F).
