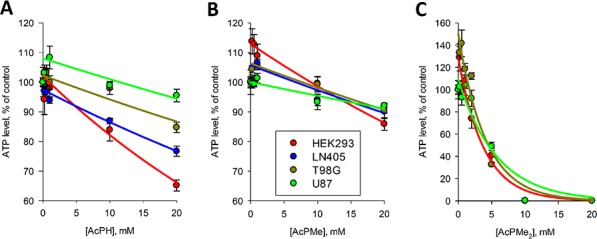
Figure 5. Influence of AcPH (A) AcPMe (B) and AcPMe2 (C) on total ATP levels of different cell cultures.

Cells were incubated with the indicated inhibitors for 5 h in HBSS. The color code and cell lines tested are shown on the graphs in order of decreased cellular sensitivity to the inhibitors. Non-linear regression to an exponential equation (y=y0e−kx) was made by SigmaPlot 12.0, with the regression parameters presented in Table 2. When observed, an increase in ATP levels in response to low concentrations of the inhibitors was excluded from the non-linear regression, which was justified by better correlation coefficients R2.
