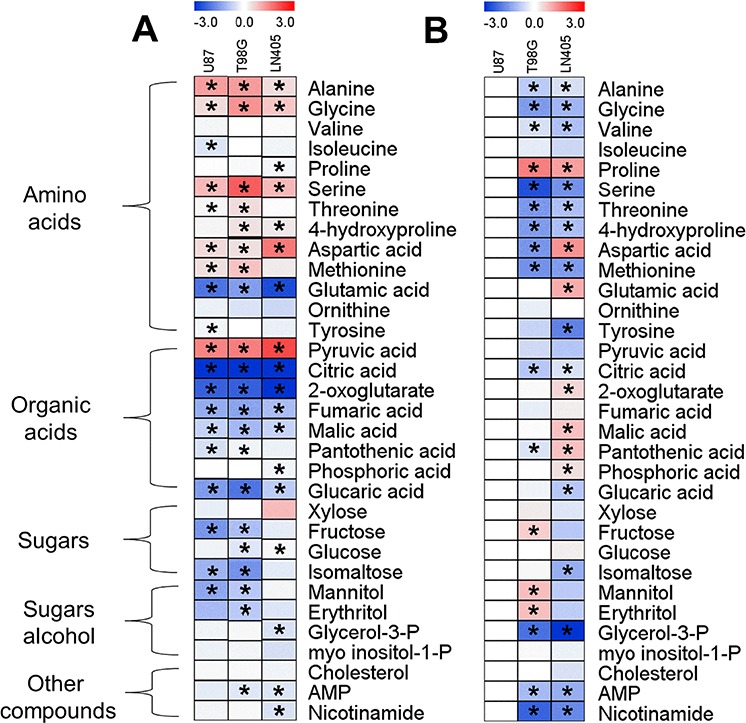
Figure 6. Comparative metabolic profiling of glioblastoma cell lines treated with 0.5 mM AcPH for 5.5 h (A) and under control conditions (B).

A. Fold changes in the metabolite levels of AcPH-treated T98G, U87 or LN405 cell lines, compared to untreated controls. B. Metabolic difference between untreated cell lines is presented as the fold changes in metabolite levels of the T98G or LN405 lines, compared to the U87 line.
