
Figure 2. Correlation of HERV-H expression with tumor cell infiltration into lymph nodes and MS status.
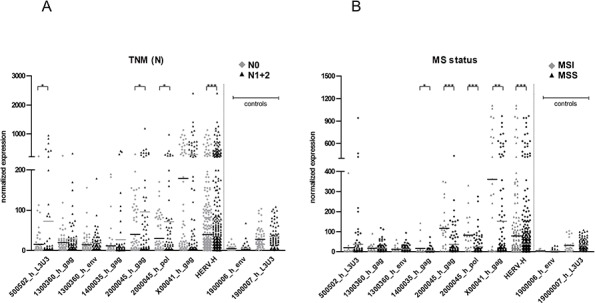
The expression of five HERV-H sequences for A. tumors with infiltration of tumor cells into lymph nodes (black triangles) or not (grey diamonds) and B. MSI (grey diamonds) and MSS (black triangles) tumors is depicted in the dot plot. Statistically significant differences in expression between MSI and MSS tumors are indicated by stars (*p < 0.05, **p < 0.01, ***p < 0.001, t-test). HERV-H: combination of all eight sequences, N0: no tumor cells in regional lymph nodes, N1: infiltration of tumor cells into regional lymph nodes, N2: infiltration of tumor cells into more distant lymph nodes; MSI: microsatellite instability, MSS: microsatellite stability. The expression of the two colon control sequences belonging to the same HERV family (HERV-H) is depicted to demonstrate no difference between the statuses.