
Figure 5. TrkB induces EMT program via upregulation of Twist-1 and Twist-2 expression.
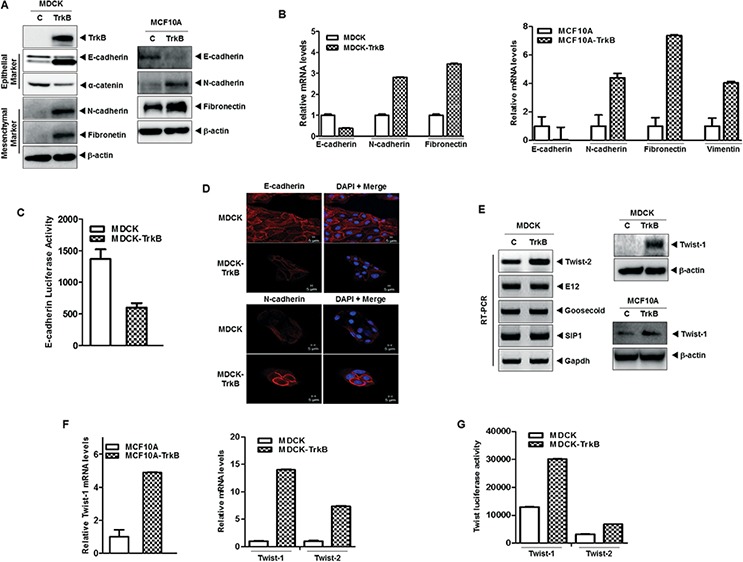
A. Western blot analysis of the expression of TrkB, E-cadherin, α-catenin, N-cadherin, and fibronetin proteins in MDCK, MCF10A, MDCK-TrkB, and MCF10A-TrkB cells. β-actin was used as a loading control. B. The relative expression levels of mRNA encoding E-cadherin, N-cadherin, vimentin, and fibronectin in MDCK, MCF10A, MDCK-TrkB, and MCF10A-TrkB cells, as determined by quantitative RT-PCR. The 18S mRNA level was used to normalize the variability in template loading. C. Promoter activity of E-cadherin gene in MDCK and MDCK-TrkB cells. Each bar represents the mean ± SEM of three experiments. D. Immunofluorescence images of E-cadherin and N-cadherin in MDCK, and MDCK-TrkB. The red signal represents staining of the corresponding protein, while the blue signal represents DAPI staining. E. Western blot analysis of the expression of Twist-1 protein (right) and RT-PCR analysis (left) of mRNA encoding Twist-2, E12, Goosecoid, SIP1, and Slug in MDCK, MCF10A, MDCK-TrkB, and MCF10A-TrkB cells. F. The relative expression levels of mRNA encoding Twist-1 and Twist-2 in MDCK, MCF10A, MCF10A-TrkB and MDCK-TrkB cells, as determined by quantitative RT-PCR. The 18S mRNA level was used to normalize the variability in template loading. G. Promoter activity of Twist-1 and Twist-2 genes in MDCK and MDCK-TrkB cells.