
Figure 3. Samples are plotted according to the pathologist estimates of the percentage of immune cells within the macrodissected FFPE tissue (x-axis) versus the immune cell score derived computationally from the transcriptional profile.
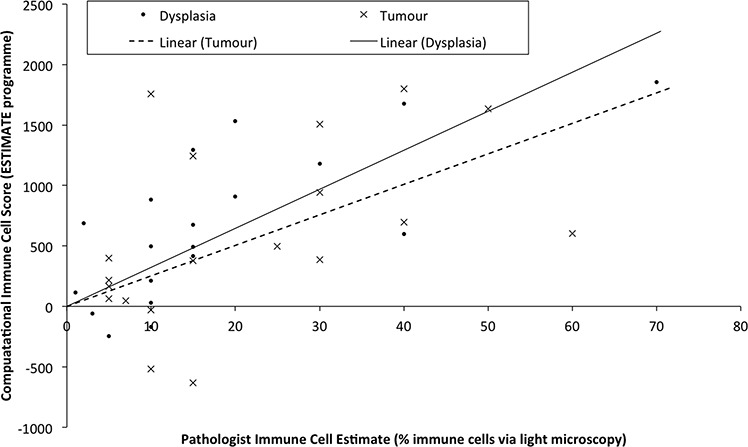
Linear regression lines for each tissue type are drawn separately as Linear (Tumour) or Linear (Dysplasia).