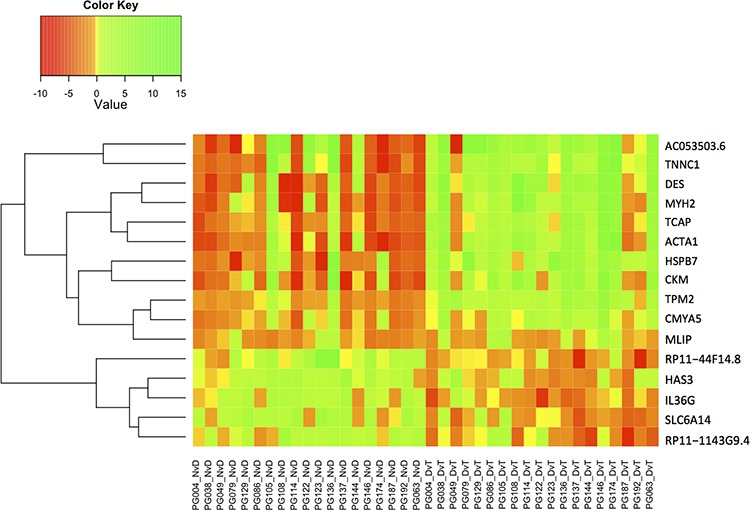
Figure 5. Heatmap indicating log2 fold change (Value) for the only 16 genes that are differentially expressed in both the NvD and DvT, but not the NvT pairwise comparison.

NvD: Normal versus Dysplasia. DvT: Dysplasia versus Tumour. NvT: Normal versus Tumour.
