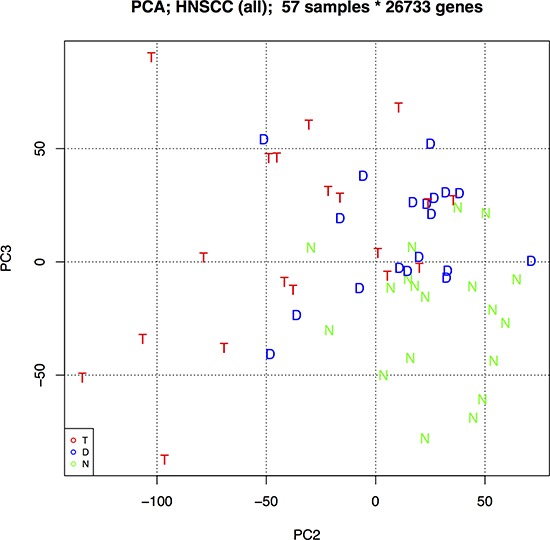
Figure 6. Principal component analysis (PCA) biplot of PCs 2 and 3 using all protein-coding and non-coding genes.

This biplot best separates the three oral sample groups: N – Normal epithelia, D – Dysplasia, and T – Tumour.

This biplot best separates the three oral sample groups: N – Normal epithelia, D – Dysplasia, and T – Tumour.