
Figure 2. Comparison of the evolutionary rate, dn/ds, between SM and FM genes.
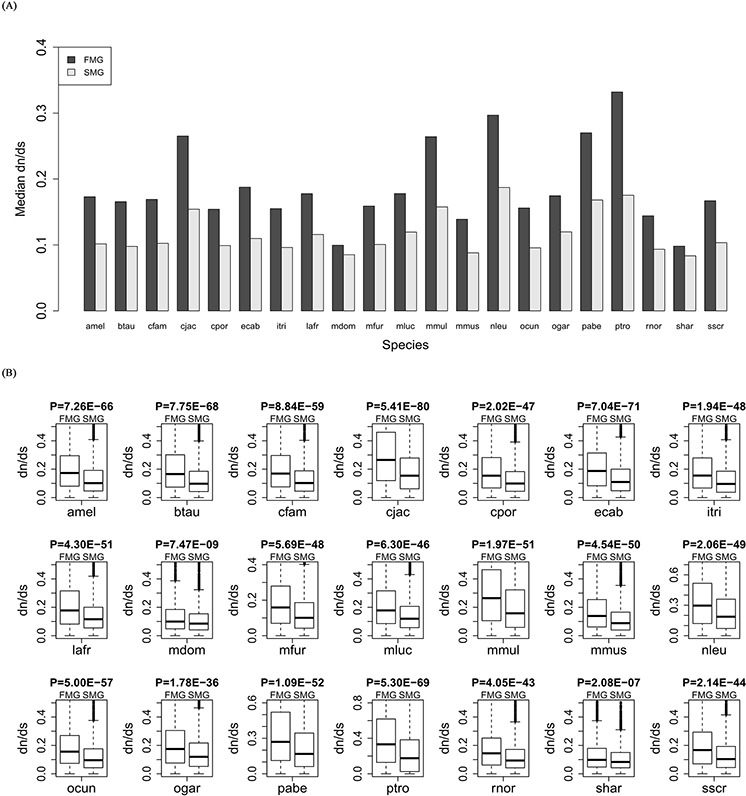
A. A bar chart of the SM genes against the FM genes. B. Box plots of the SM genes against the FM genes for each of the 21 species.
Official websites use .gov
A
.gov website belongs to an official
government organization in the United States.
Secure .gov websites use HTTPS
A lock (
) or https:// means you've safely
connected to the .gov website. Share sensitive
information only on official, secure websites.
A. A bar chart of the SM genes against the FM genes. B. Box plots of the SM genes against the FM genes for each of the 21 species.