
Figure 1. Manhattan plot of −log10 P values from the additive model after adjusting for age, gender and ten principal components.
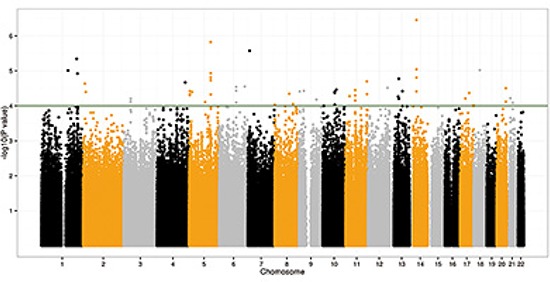
Forty-nine SNPs were significant at the P < 10−4 level in the CRC discovery GWA scan.
Official websites use .gov
A
.gov website belongs to an official
government organization in the United States.
Secure .gov websites use HTTPS
A lock (
) or https:// means you've safely
connected to the .gov website. Share sensitive
information only on official, secure websites.
Forty-nine SNPs were significant at the P < 10−4 level in the CRC discovery GWA scan.