
Figure 1. Differential protein expression identified by antibody microarray profiling.
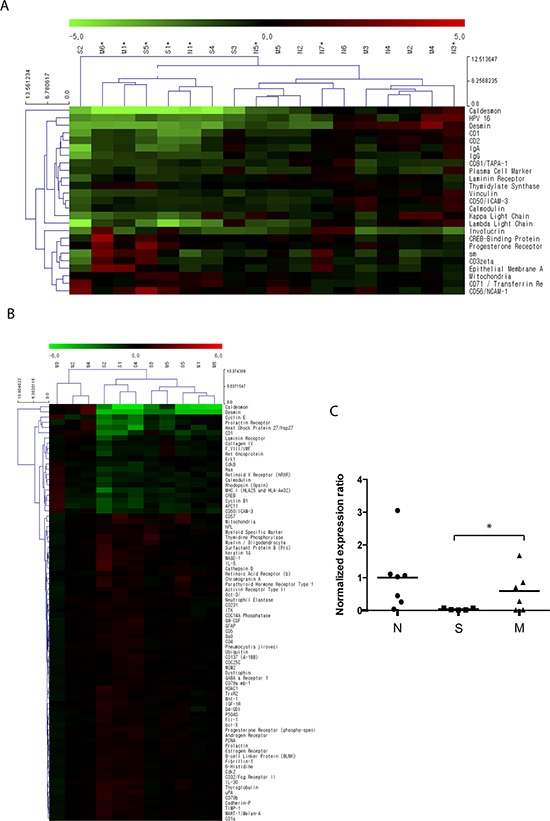
A total of 11 bladder cancer (BC) tissue samples were acquired from patients who were diagnosed with primary non-muscle-invasive BC (NMIBC) following complete TURBT (n = 5, designated as ‘S’) and muscle-invasive BC following radical cystectomy (n = 6, designated as ‘M’). A total of 7 normal bladder mucosal tissues (designated as ‘N’) were obtained from the normal bladder mucosa of patients undergoing TURBT (n = 3) or from a tissue biobank (n = 4, tissues from patients undergoing transurethral resection of the prostate and augmentation cystoplasty). Protein expression in the 18 tissue samples was analyzed using an antibody microarray kit with 656 antibodies. A. Hierarchical clustering analysis of protein expression in BC tissues and normal tissues. Proteins shown in the right column are those with a > 1.5-fold (or < 0.667) change with p values < 0.1. Red indicates higher expression in BC tissues as compared to normal tissues; green indicates lower expression in BC tissues. Further detailed information is accessible through GEO Series accession number GSE69736 (http://www.ncbi.nlm.nih.gov/geo/query/acc.cgi?acc=GSE69736). B. Differential protein expression between primary NMIBC and muscle-invasive BC tissues. Proteins shown in the right column are those with p values < 0.1. Red indicates higher expression in NMIBC compared to muscle-invasive BC tissues; green indicates lower expression in NMIBC tissues. Expression of caldesmon in muscle-invasive BC tissues was significantly higher than that in NMIBC tissues. C. Statistical analysis for normalized expression ratio of caldesmon in the antibody microarray profiling (*p = 0.043).