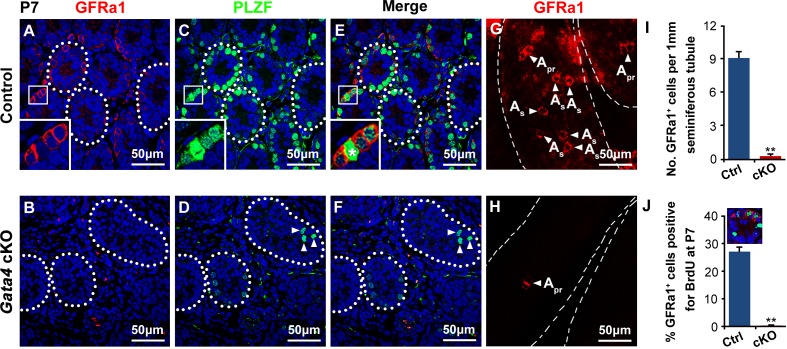
Figure 3. Few GFRa1+ or PLZF+ spermatogonial progenitors within the Gata4 cKO testes.
A., B. Testis sections from control and Gata4 cKO mice at P7 were probed with antisera against GFRa1 (red). The nuclei are counterstained with DAPI (blue). C., D. Immunofluorescence staining for PLZF (green) in control and Gata4 cKO testis sections at P7. The white arrowheads in D. indicate the low number of PLZF+ spermatogonia within Gata4 cKO testes. The white dotted lines indicate the testicular tubules. Scale bar, 50 μm. E. and F. are the merged images of A+B and C+D, respectively. G., H. Representative images of staining for GFRa1 (red)-expressing cells in a whole-mount seminiferous tubule at P7. The white arrowheads indicate Asingle and Apaired spermatogonia according to their morphology. I. Density of GFRa1+ spermatogonia per 1 mm in seminiferous tubules of the control and Gata4 cKO testes (n = 3 each). The data are expressed as the mean±S.D. **p < 0.01. J. BrdU-labeling index of GFRa1+ spermatogonia in control and Gata4 cKO testes at P7. BrdU was injected 4 h before the mice were sacrificed. The data are expressed as the mean±S.D. **p < 0.01.

