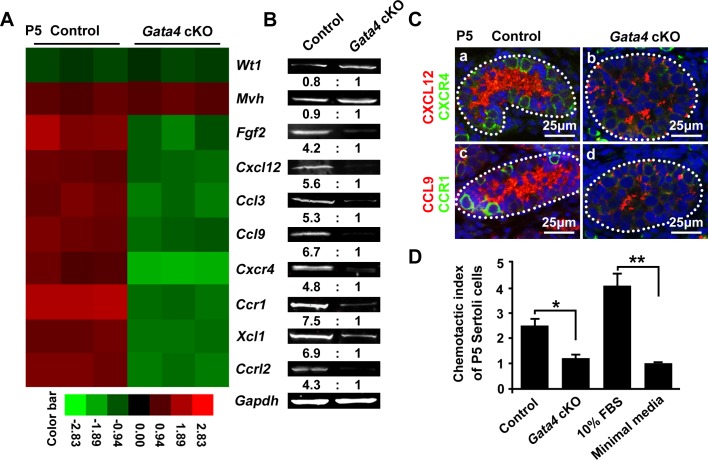
Figure 6. Identification of altered chemokine-related genes in Gata4 cKO testes at P5.
A. A heat map analysis of control and Gata4 cKO (n = 3 each) testes at P5. Geen and red represent low and high expression levels, respectively. B. RT-PCR analyses of the indicated genes in control and Gata4 cKO testes (n = 3 each) at P5. The numbers at the bottom represent the relative fold reduction measured via the density analysis. Wt1 is a marker of Sertoli cells, and Mvh is a marker of germ cells. Gapdh served as the internal control gene. C. Representative images of immunofluorescent staining for CXCL12 (red) and CXCR4 (green) expression in cross-sections of testes from control (a) and Gata4 cKO (b) mice at P5. Expression of CCL9 (red) and CCR1 (green) within the tubules of control (c) and Gata4 cKO (d) testes at P5. DAPI was used to stain DNA. The white dotted lines indicate the testicular tubules. Scale bar: 25 μm. D. The ability of stem/progenitor spermatogonia to migrate toward Sertoli cells was expressed as the chemotactic index. The chemotactic index with respect to the 10% FBS positive control was approximately three-fold greater compared to the negative control. The chemotactic index of the Gata4-deficient Sertoli cells was not significantly different than that of the negative control, which corresponded to only minimal media. The data are expressed as the mean±S.D. *p < 0.05, **p < 0.01.

