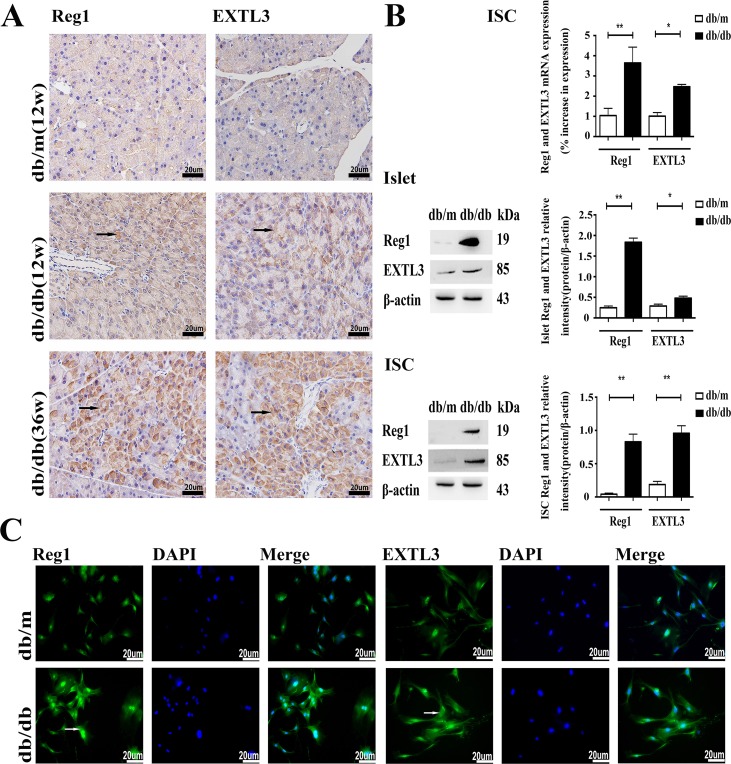
Figure 1. Expression of Reg1 and EXTL3 in pancreas, islets and ISCs.
A. Wax-embedded sections of db/db and db/m mouse pancreases showing expression of Reg1 and EXTL3 by immunohistochemistry. Scale bar = 20μm. B. Quantification of Reg1 and EXTL3 mRNA and protein by qRT-PCR and Western blotting respectively in islets and ISCs. Data are expressed as mean ± SE (n = 3), * P < 0.05, ** P< 0.01, db/db ISCs compared with db/m ISCs. C. Immunofluorescent staining of ISCs by Reg1 and EXTL3 antibodies (green). Scale bar = 20μm.

