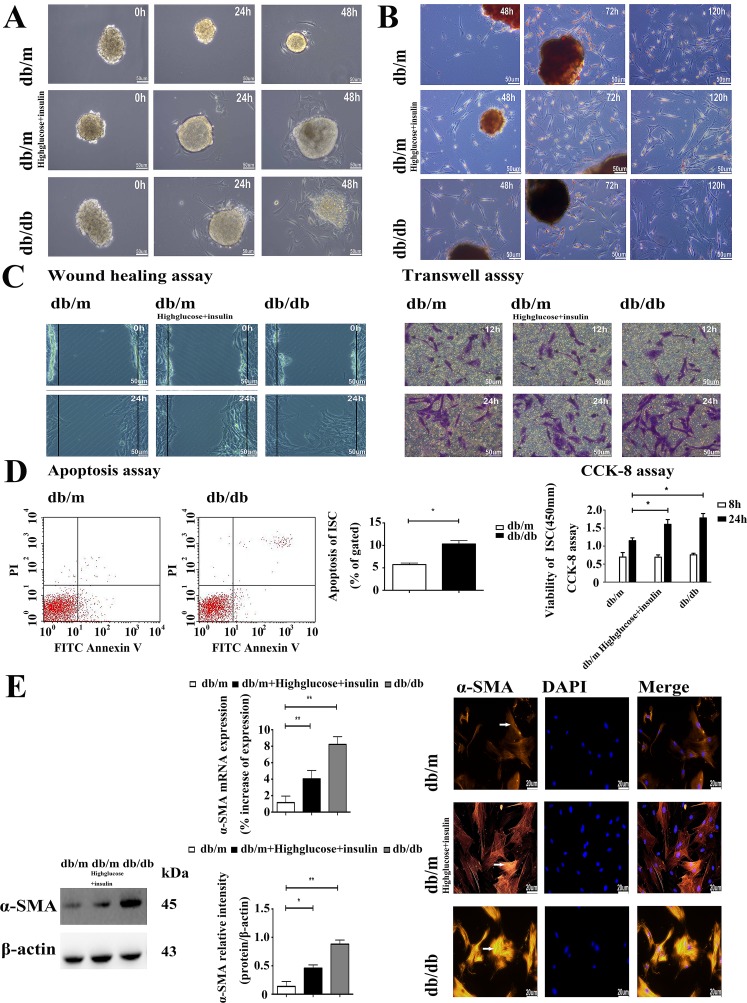
Figure 2. The diabetic environment promotes the activation of ISCs.
A. Light microscopy micrographs demonstrating faster rates of ISC outgrowth from diabetic islets. Scale bar = 50μm. B. Oil red “O” staining of lipid droplets in cytoplasm from ISCs shows faster activation and loss of lipid droplets in diabetic ISCs. Scale bar = 50μm. C. Wound healing assay of migration rate shows greater migration of diabetic ISCs. Transwell assay of migration rate shows more diabetic ISCs migrating across the filter. Scale bar = 50μm. D. CCK-8 assay of viability in ISCs. Data are expressed as mean ± SE (n = 15), * P< 0.05, ** P< 0.01. Apoptosis assay of apoptosis in ISCs. Data are expressed as mean ± SE (n = 3), * P< 0.05, ** P< 0.01. E. qRT-PCR and Western blotting of α-SMA mRNA and protein expression in ISCs. Data are expressed as mean ± SE (n = 3), * P < 0.05, ** P< 0.01. Immunofluorescent staining of ISCs by α-SMA antibody. Scale bar = 20μm.

