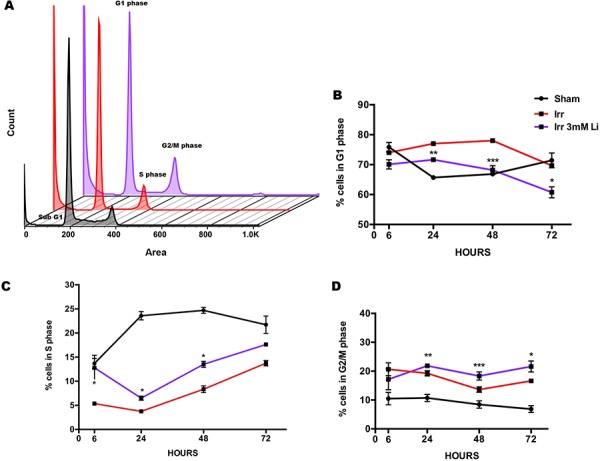
Figure 3. Lithium at 3 mM rescues proliferating cells in S phase.

A. Propidium iodide (PI) histograms representing the different phases of the cell cycle distribution in sham (black), irradiated (red) and irradiated+3 mM LiCl (purple). B. Quantification of the percentages of cells in G1 phase of the cell cycle providing additional evidence of irradiation inducing an arrest in this phase at 24 and 48 hours, ****p24 hours < 0.0001, *p48 hours = 0.0007. Lithium at 3 mM was able to reduce the proportion of cells arrested in G1 after irradiation at 24, 48 and 72 hours **p3 mM_24 hours = 0.0070, ***p3 mM_48 hours = 0.0006 and *p3 mM_72 hours = 0.0121. C. Quantification over time of the proportion of cells in S phase shows that very few events were found in this phase after irradiation, indicating a negative effect on proliferation at any given time, **p6 hours = 0.0012, ****p24 hours < 0.0001, ****p48 hours < 0.0001, **p72 hours = 0.0018. Lithium at 3 mM dose restored the proliferating pool 6 hours after irradiation and this moderate effect was also observed at 24 and 48 hours, *p3 mM_6 vhours = 0.0265, *p3 mM_24 hours = 0.0359, *p3 mM_48 hours = 0.0225. D. Quantification of the distribution of the cells in G2/M phase over time shows a pattern of accumulation in this cell phase after irradiation, **p6 hours = 0.0074, ****p24 hours < 0.0001, **p48 hours = 0.0012, **p72 hours = 0.0011. Even a more prominent stall in G2/M phase was observed after irradiation in combination with 3 mM LiCl treatment, **p3 mM_24 hours = 0.0072, ***p3 mM_48 hours = 0.0005, *p3 mM_72 hours = 0.0232. Asterisks in the graph represent significant differences between the irradiated NSPCs and the irradiated NSPCs treated with lithium. Data are presented as mean ± SEM, n = 3–6.
