
Figure 1. EGFR exists in the mitochondria of NSCLC cells and translocates through endocytosis.
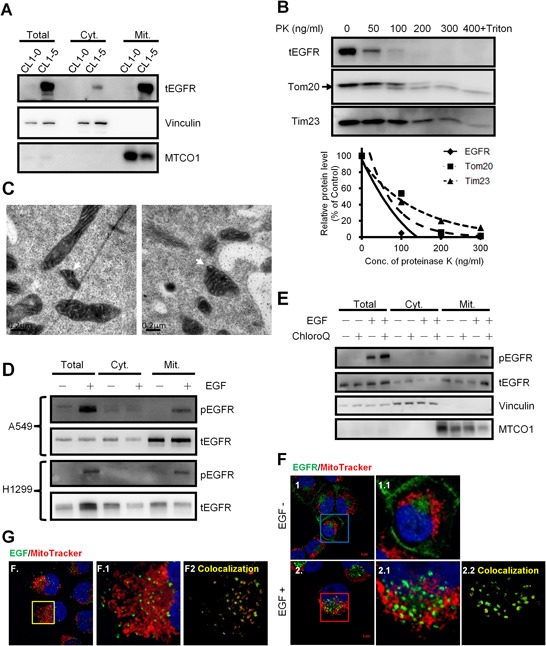
A. Western blotting of the subcellular fractions of CL1–0 and CL1–5 cells. Vinculin and MTCO1 serves as a membranous, cytosolic marker and a mitochondrial marker, respectively. Cyt. and Mit. represent the cytosolic fraction without membranous organelles and the mitochondrial fraction, respectively. B. Proteinase K digestion assay for mitochondria fractions of H1299 cells. The intact mitochondria of H1299 was extracted and then incubated with the indicated concentration of PK at 25°C for 30 min. The fraction with PK and 0.1% of Triton X-100 serves as the negative control. After incubation, the mixture was subjected to immunoblotting. Tom20 and Tim23 serve as the markers for the outer and inner membrane of the mitochondria, respectively. The upper right panel showed the relative protein level digested by PK. C. H1299 cells were starved for 24 h, treated with40 ng/ml for 10 min., and then processed for immunoelectron microscopy analysis. White arrows indicate positive EGFR staining in the mitochondria. Scale bar: 0.2 μm. D. After serum starvation for 24 h, A549 and H1299 cells were treated with 40 ng/ml of EGF at 37°C for 30 min, and then subjected to the mitochondrial fractionation and immunoblotting. E. Starved H1299 cells were pretreated with 0.5 mM of chloroquine for 3 h at 37°C, and then treated with 40 ng/ml of EGF for 15 min. Then the treated cells were subjected into the mitochondrial fractionation and immunoblotting. F. H1299 cells were seeded on the coverslips and serum starved for 24 h. Cells were treated with 40 ng/ml of EGF and 200 nM of MitoTracker for 10 min. Anti-EGFR antibody was used for the immunofluorescence staining. The panels 1.1 and 2.1 are the magnified images of the square in the left panels. The panel 2.2 shows the signals of the colocalization of MitoTracker and EGFR analyzed by ZEN2009 software. Scale bar: 5 μm. G. H1299 cells were serum starved for 24 h and then treated with 200 ng/ml of EGF-Alexa Fluor 488 and 200 nM of MitoTracker for 10 min. The panel F.1 is the magnified image of the square in the left panels. The panel F.2 shows the signals of the colocalization of MitoTracker and EGF-Alexa Fluor 488 analyzed by ZEN2009 software. Scale bar: 5 μm.