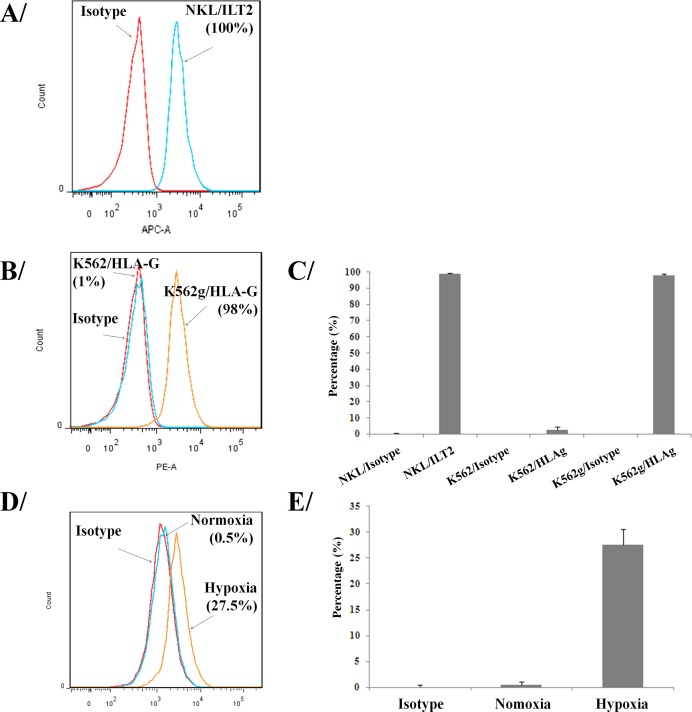
Figure 1. Expression of HLA-G and its ligand on tumor and immune cells.
Flow cytometry assessment of ILT2 (HLA-G ligand) on NKL cells A. and C. Flow cytometry analysis of HLA-G surface expression on K562 and modified K562g cells B. and C., and HLA-G up-regulation on HLA-G− LCL cells submitted to hypoxia D. and E. Results shown in A, B, and D are from one representative experiment of four performed. C. and E. show the percentage of positives cells for 3 pooled experiments in each panel (means ± SD).

