
Figure 5. CL4 inhibits EGFRvIII-GBM cell growth.
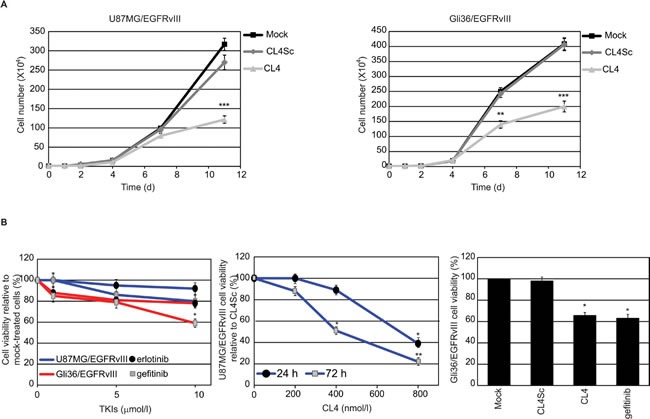
A. U87MG/EGFRvIII (left) and Gli36/EGFRvIII (right) cells (104 cells/3.5-cm plate) were either mock-treated or treated with CL4 or CL4Sc (200 nmol/l-final concentration) and counted through the Bürker chamber at the indicated time points. The aptamer treatment was renewed each 24 hours. Growth curves represent the average of three independent experiments and error bars represent SD. ***P < 0.001; **P < 0.01 relative to CL4Sc. B. Left, U87MG/EGFRvIII (blue line) and Gli36/EGFRvIII (red line) cells were mock-treated or treated for 72 hours with increasing amounts of erlotinib or gefitinb. Middle, U87MG/EGFRvIII cells were treated for the indicated times with increasing amounts of CL4 or CL4Sc. Right, Gli36/EGFRvIII cells were mock-treated or treated for 72 hours with 10 μmol/l gefitinib or 200 nmol/l CL4 or CL4Sc. Cell viability was analyzed and expressed as percent of viable treated cells with respect to mock-treated (left and right) or CL4Sc (middle) controls. In middle, no statistically significant variations among CL4Sc- and mock-treatment was obtained. Each determination represents the average of three individual experiments and error bars represent SD. **P < 0.01; *P < 0.05 relative to controls.