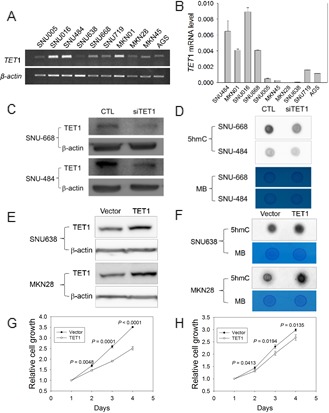
Figure 2. TET1 siRNA analysis and TET1 overexpression in GC cells.

A., B. Analysis of TET1 mRNA level in 10 GC cell lines with RT-PCR. A. or quantitative real-time RT-PCR. B.β-actin was used as a control. C., D. TET1 expression in knockdown cells using TET1 siRNA. C. Western blotting with SNU484 and SNU668 cells in which siTET1 was transiently expressed. β-actin was used as a control (CTL). D. Dot blot assay with anti-5hmC using 700 ng DNA from the siTET1-treated cells in Figure 2C. E., F. Experiment for TET1 overexpression.E. Western blotting after TET1 transfection into SNU638 and MKN28 cells. β-actin was used as a control. F.Dot blot assay with anti-5hmC and DNA from transfected cells in Figure 2E with 700 ng DNA. G., H. Cell proliferation assay. Transfectants expressing vector only or the TET1 expression vector were cultured for 1-4 days, and then cell proliferation was measured using a CCK-8 kit (G, assay for SNU638; H, for MKN28). The data are cell index curves with mean ± SD from triplicate experiments. MB, methylene blue.
