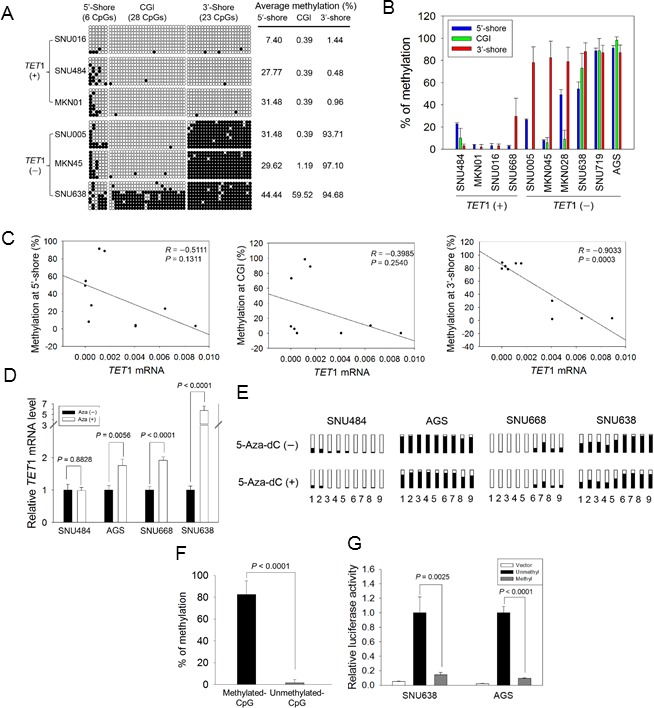
Figure 4. Association between CpG methylation proximal to the TET1 promoter and its expression in GC cell lines.

A. Bisulfite sequencing of GC cell lines was performed for the three regions indicated in Figure 3D with three TET1-expressing (+) and another three TET1-silenced (−) cell lines. Open circles, unmethylated CpG sites; filled circles, methylated CpG sites. Each row represents a single clone. The numbers on the right represent the mean percentages of CpG sites that were methylated for each cell line. B. Pairwise comparison of CpG methylation with TET1 mRNA level in GC cell lines. CpG methylation in three regions and mRNA level were quantified for each cell line with pyrosequencing and real-time RT-PCR. Each experiment was performed in triplicate. C. Pearson's correlation analysis between mRNA level and CpG methylation in the 5′-shore (left panel), the CGI (middle), and the 3′-shore (right). This analysis was performed using the dataset in Figure 4B. D. Restoration of TET1 expression after 5-Aza-dC treatment. Real-time RT-PCR was used to examine four GC cell lines: SNU484, AGS, SNU668, and SNU638, before and after 5-Aza-dC treatment. Each value is the mean ± SD of three independent experiments. E. Comparison of CpG methylation status before and after 5-Aza-dC treatment. Pyrosequencing was performed for the CpG sites indicated in Figure 3D: 1 and 2, two CpGs from the 5′-shore; 3 to 5, three CpGs from the CGI; 6 to 9, four CpGs from the 3′-shore. Open squares indicate CpG sites that are fully unmethylated; black squares indicate various degrees of CpG methylation. F. Luciferase activity in the 3′-shore in GC cells. Methylated and unmethylated reporter constructs for 613 bp from the 3′-shore were established, and each methylation status was confirmed with pyrosequencing (left panel). Luciferase activity was examined in SNU638 and AGS cells, showing that the activity was significantly reduced in the methylated construct compared with the unmethylated construct (P = 0.002, P < 0.0001, respectively) (right panel). Each value is the mean ± SD of three independent experiments.
