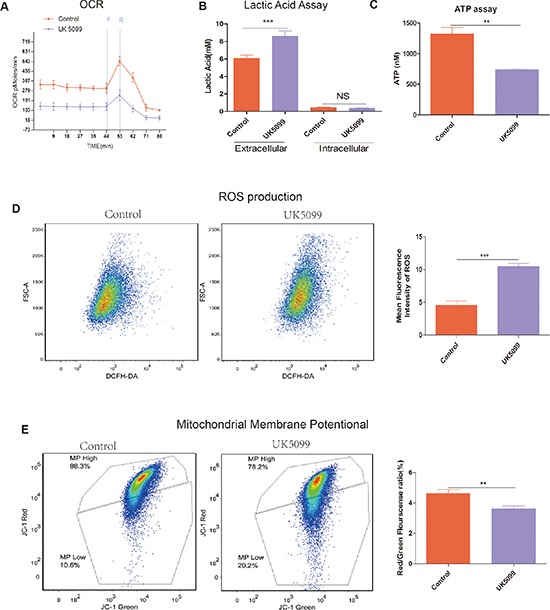
Figure 3. UK5099 attenuated mitochondrial function and increased glycolysis.

A. OCR (pmol/min/50000 cells) measurements were obtained at baseline and by adding carbonylcyanide-p-trifluoromethoxyphenylhydrazone (FCCP, F, 400 nM) to uncouple the mitochondria for maximal OCR and Reteno(R, 1 mM). B. UK5099 increased extracellular lactate acid level and had no effect on intracellular lactate acid. Lactate level was determined by lactate assay kit. Total ATP levels were expressed as mmol/106cells. Data were shown as mean ±SD. C. UK5099 decreased ATP production. ATP production was obtained by using ATP assay kit. Data were shown as mean ± SD (nmol/106). D. Significantly higher level of ROS in UK5099 treated cells. Left panel shows representative ROS flow cytometry graphs while the right panel shows histograms of the mean fluorescence intensities of ROS obtained with microplate reader. Data were expressed by mean fluorescence ± SD. E. UK5099 decreased mitochondrial membrane potential (ΔΨm) in LnCap cell. ΔΨm was measured with a unique cationic dye of 5,5′,6,6′-tetrachloro 1,1′,3,3′-tetraethylbenzimidazolcarbocyaenina iodide (JC-1) and analyzed with a flow cytometer as shown in Materials and Methods. * vs control p < 0.05; ** vs control p < 0.01; ***p < 0.001.
