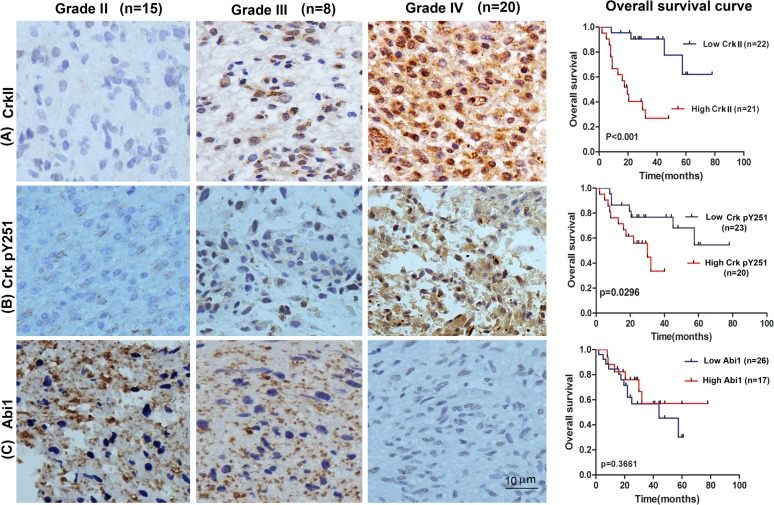
Figure 2. Tissue microarray of GBM patient tumor samples reveals reciprocal expression of Crk and Abi1 in glioblastoma.
Representative images of upregulated tissue expression of A. Crk and B. Crk pY251 in Grade IV glioblastoma (middle panels) versus Grade I glioma (left panels). Kaplan-Meier survival curves show high expression of Crk and Crk phospho-Y251 are correlated with low overall survival in GBM patients (A-B, right panels). C. Abi1 tissue expression is downregulated in Grade IV glioblastoma versus Grade I glioma and is correlated with lower overall survival. See also Supplementary Figure S1, S2 and Table 1–3 and Supplementary Tables 1-2.

