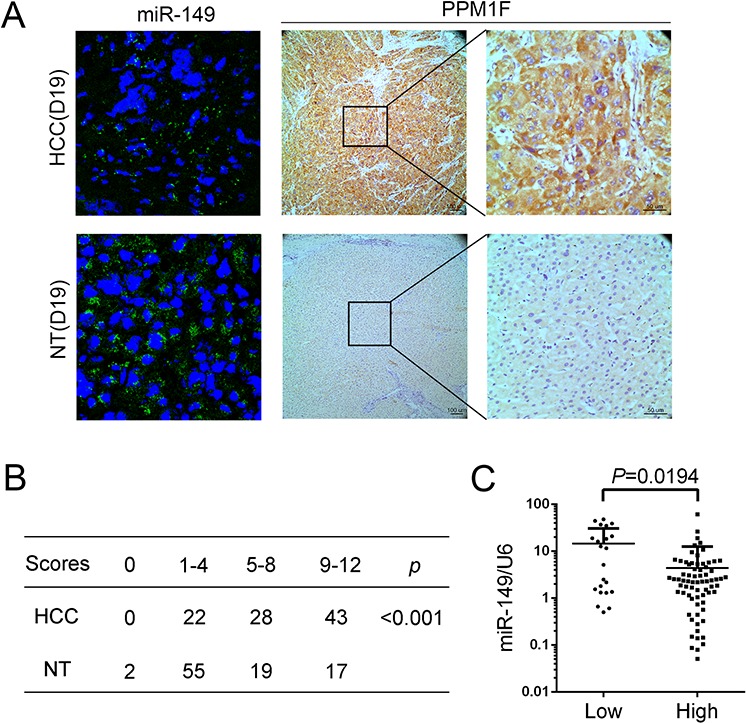
Figure 4. PPM1F is frequently up-regulated and inversely associated with the expression of miR-149 in HCC.

A. Detection of miR-149 (Fluorescence in situ hybridization) and PPM1F (Immunohistochemistry) expression in the same HCC and corresponding non-tumorous tissue (D19). The cell nuclei were stained with DAPI (blue). B. The statistical analysis of 95 pairs of HCC tissues and their corresponding non-tumorous liver tissues according to immunohistochemical staining scoring. Statistical significance was assessed using the X2 test. C. Correlation analysis between the expression levels of miR-149 and PPM1F. The scatter plot indicated the relative expression of miR-149 in the high or low PPM1F expression groups. The expression levels of PPM1F were ranked according to the results of immunohistochemical staining. Scores of 1 or 2 were classified as low expression, and scores of 3 or 4 were classified as high expression. A statistical analysis was performed using Student's t test.
