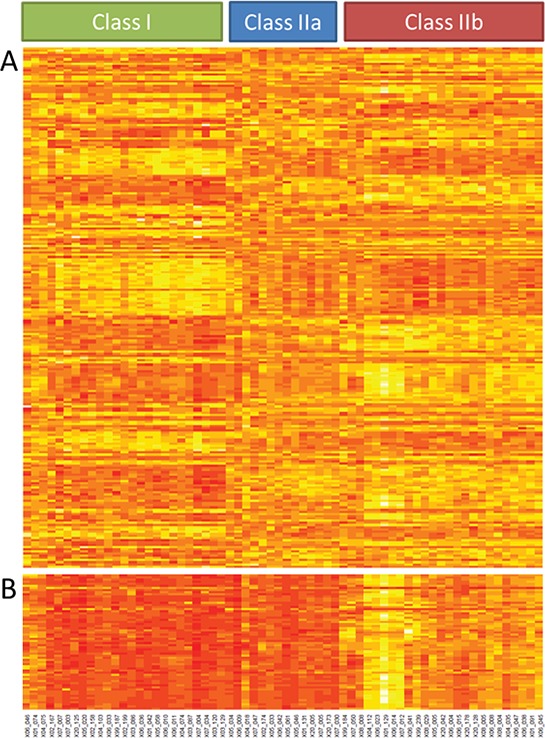
Figure 1. Gene expression analysis.

Unsupervised clustering of gene expression of 64 UM divides tumors in two classes. Supervised cluster analysis with the 237 most differentially expressed genes resulted in 3 classes because class II is subdivided in class IIa and class IIb A. Supervised clustering of the 53 class IIb classifier genes B.
