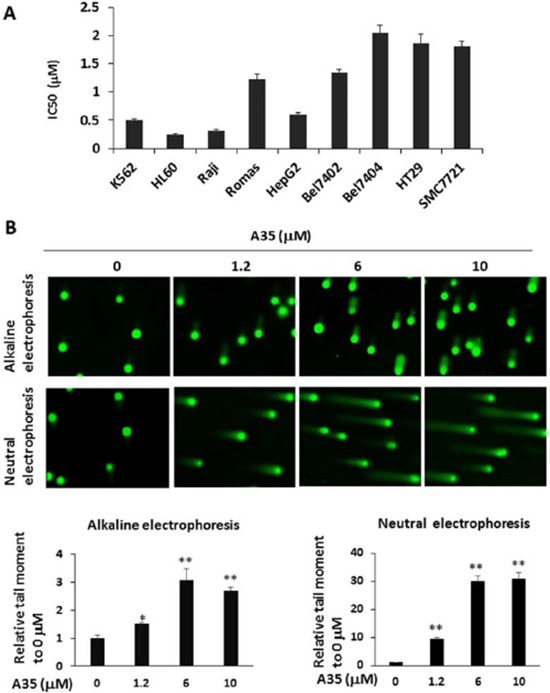
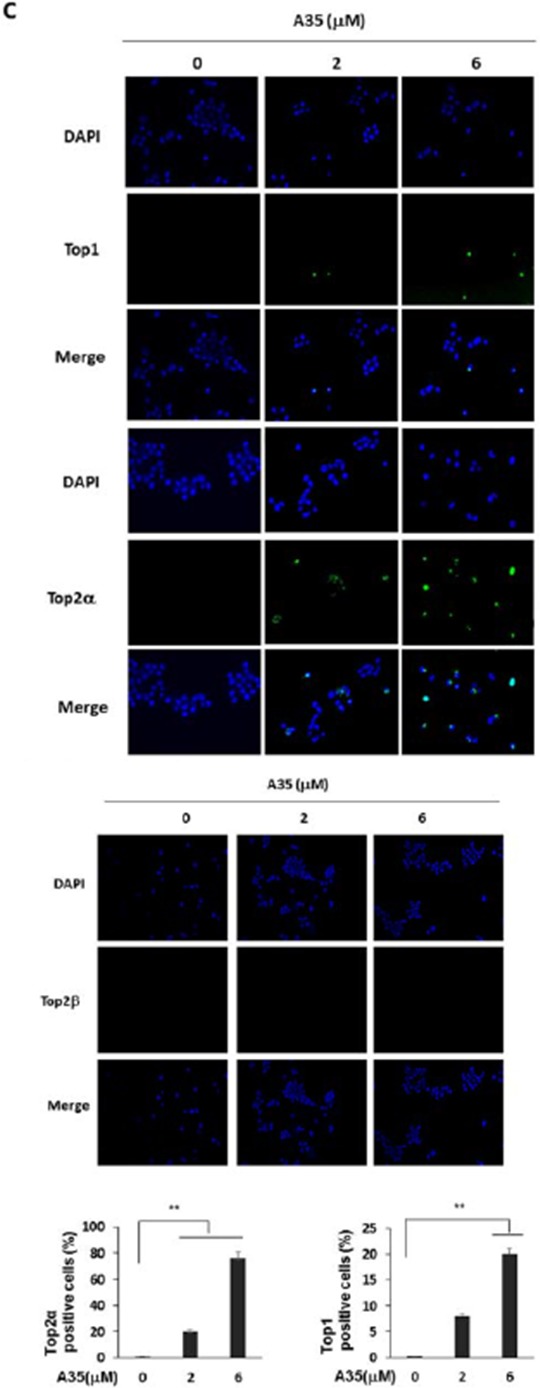
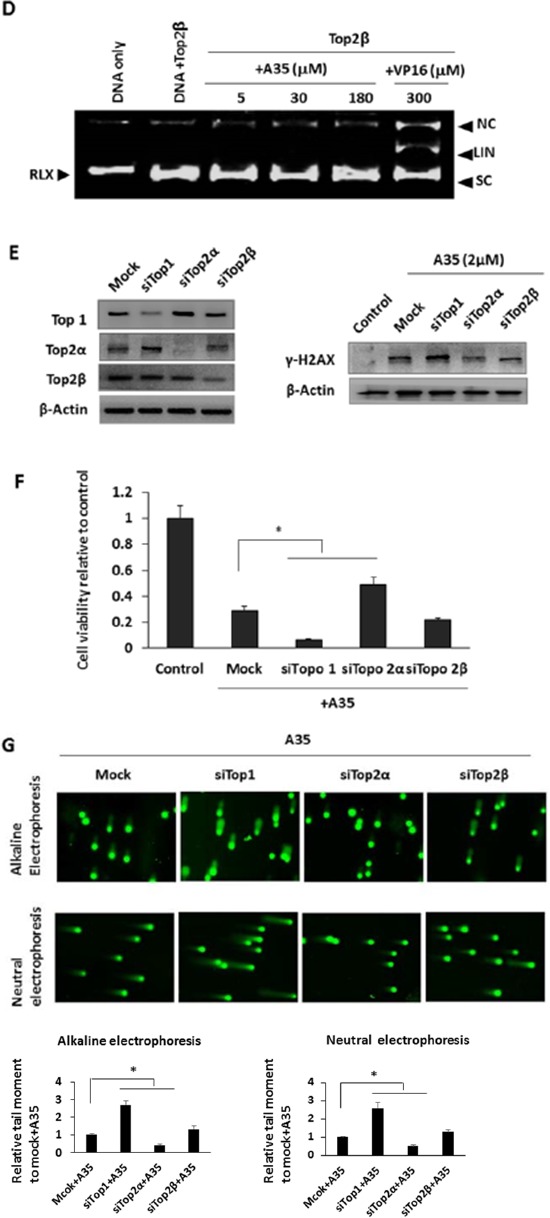
Figure 4. Compared with top1, top2α was preferentially and specifically targeted in A35-induced cell DNA strand breaks, top-DNA covalent complexes and growth inhibition.


A. IC50 of A35 in various cancer cells. Cells were treated with different concentrations of A35 for 48 hrs, and IC50 was evaluated with SigmaPlot. B. K562 cells were treated for 1.5 hours in the presence of A35, and cells were collected and alkaline comet electrophoresis and neutral comet electrophoresis assays were performed. The quantitative analysis was performed with the comet analysis software CASP, and the parameters TM (tail moment) was employed to evaluate DNA damage. Assays were repeated three times and the mean value of TM was normalized to the control (0 μM). C. K562 cells were treated with increasing concentrations of A35 for 1.5 hours, and the formation of DNA-top covalent complexes was analyzed by TARIDS assay. Nuclei were counterstained with DAPI. The histogram shows the percentage of top2α-positive or top1-positive cells. The results of a single experiment are shown; 50 nuclei were analyzed in each assay. D. The DNA pBR322 was incubated with purified top2β with or without the indicated concentrations of A35 or VP16. Reaction products were separated by 1.4% agarose gel electrophoresis in the presence of the nucleic staining agent EB. K562 cells were transfected with top1 or top2 siRNA for 48 hours, and top1 and top2 levels were detected E. 1.2 μM A35 was then added into the top1 or top2 silenced cells and incubated for 24 hours to examine γ-H2AX levels (E) and cell survival F. Incubation for 1.5 hours to detect DNA single or double strand breakages via alkaline or neutral comet electrophoresis G. *P < 0.05;** P < 0.01
