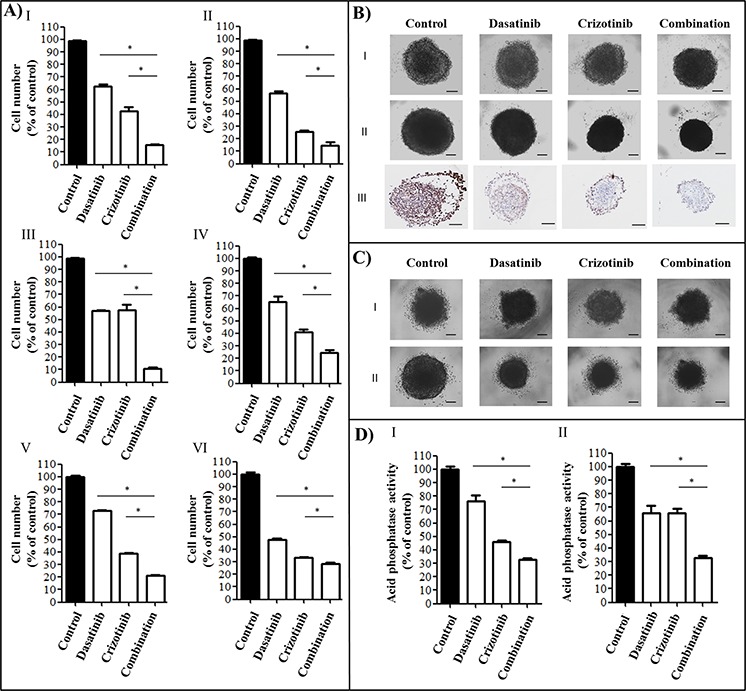
Figure 1. Cytotoxicity of a combination of dasatinib and crizotinib on GBM cell lines and GBM tumor spheroids.

A. Cell number was measured following 72 h of treatment at concentrations of 0.2 μM dasatinib and 4 μM crizotinib using an SRB assay in I: U87, II: LN-18, III: U373, IV: A172, V: NZG1003 and VI: NZG0906 cells. Data are expressed as the mean ± SEM. Experiments were conducted in triplicate and repeated independently three times. B. U87 spheroids I: before treatment, II: following 4 days treatment and III: Ki67 staining of spheroids treated for 4 days. Experiments were conducted in sextuplicate and repeated independently three times, representative images are shown. C. NZG1003 spheroids I: before treatment and II: following 4 days treatment. Experiments were conducted in sextuplicate and repeated independently three times, representative images are shown. D. Acid phosphatase assay of I: U87 and II: NZG1003 spheroids following 4 days of treatment. Data are expressed as the mean ± SEM. Experiments were conducted in sextuplicate and repeated independently three times. Scale bars denote 100 μm, * denotes p ≤ 0.05 as determined by an ANOVA with a Bonferroni post-hoc test.
