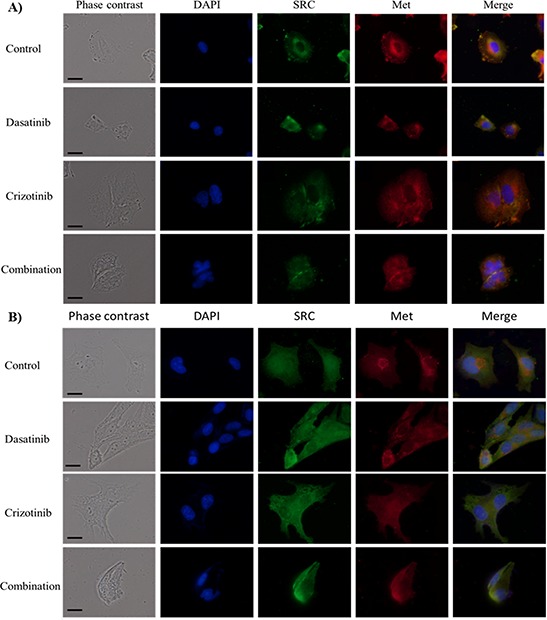
Figure 3. Immunocytochemistry of SRC and Met localization.

Cellular localization of SRC and Met following treatment for 48 h with dasatinib, crizotinib or combination in A. LN-18 and B. U373 cells. Scale bar denotes 10 μm. Nuclei were visualized by DAPI while SRC and Met were labeled with a fluorescein and Texas-red conjugated secondary antibodies, respectively.
