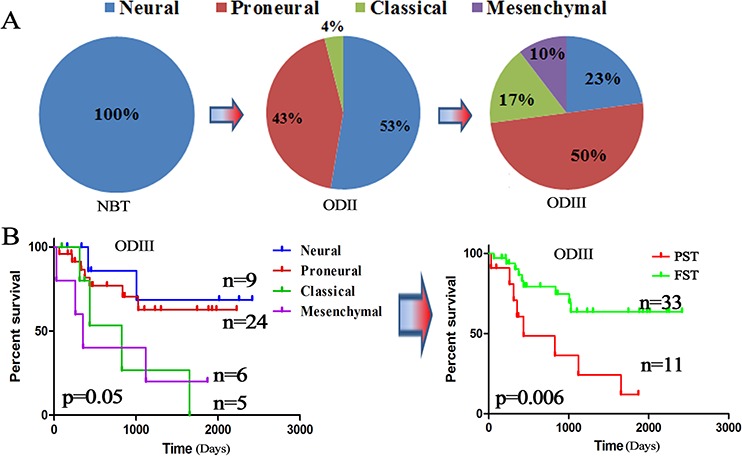
Figure 1. TCGA subtypes were associated with OD grades.

A. The distribution of the TCGA subtypes in different grades of ODs from the CGGA dataset (5 NBTs, 76 ODIIs and 48 ODIIIs); B. Kaplan–Meier survival analysis divided the TCGA subtypes into a favorable survival subtype (FST: neural and proneural) and a poor survival subtype (PST: classical and mesenchymal) based on the CGGA dataset.
