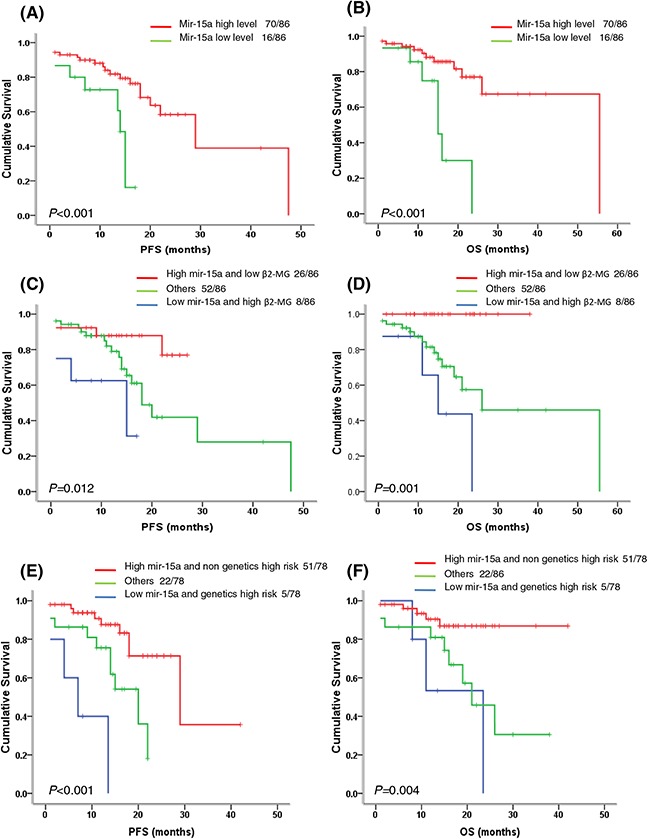
Figure 3. Survival analysis of miR-15a in newly diagnosed MM patients.

A–B. Patients with low miR-15a expression (<2.35) have significantly shortened PFS (P < 0.001) and OS (P < 0.001). C–D. The patients with low miR-15a expression and high β2-MG had the shortest PFS and OS, followed by the patients with low miR-15a expression or high β2-MG, the patients with high miR-15a expression and low β2-MG had relatively better outcomes (P = 0.012, P = 0.001). E–F. The patients with low miR-15a expression and high risk genetics had the shortest PFS and OS, followed by the patients with low miR-15a expression or high risk genetics, the patients with high miR-15a expression and non high risk genetics had relatively better outcomes (P < 0.001, P = 0.004).
