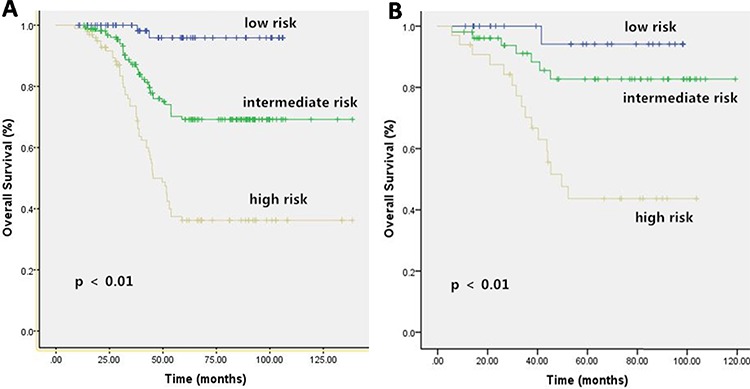
Figure 4. Kaplan-Meier Curves for Overall Survival (OS) in Training Set A. and Validation Set B.

A. Eleven subgroups of development cohort merged to form three categories with significantly different prognoses. B. There were significant statistical differences on 5 year OS among the three categories of validation cohort, according to our prognostic classification.
