
Figure 4. Detection of tumor-specific chromosomal rearrangements in liquid biopsies from Patient #3.
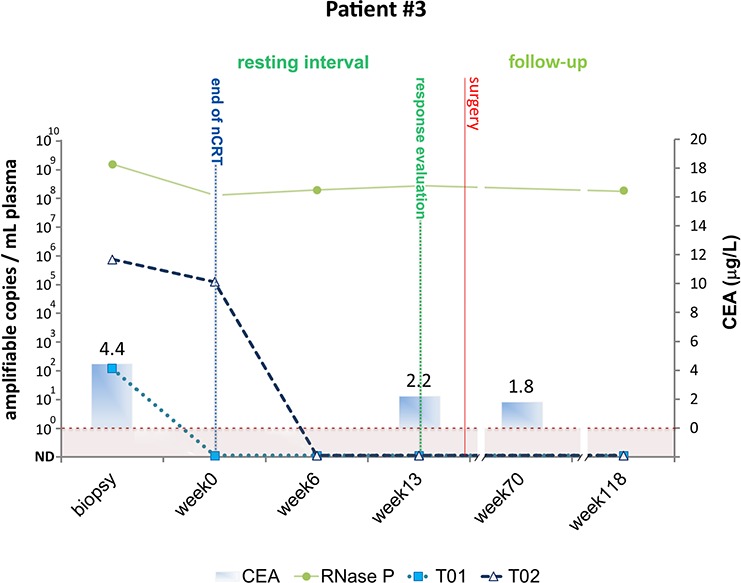
Serial blood samples were collected prospectively at diagnosis (biopsy), at the end of nCRT (week 0) during the resting interval (week 6), at the time of clinical evaluation of response (week 13), and during follow-up (weeks 70 and 118). The initial treatment for Patient #1 included nCRT and radical surgery for removal of residual tumor. TaqMan assays amplifying patient specific chromosomal rearrangements (T01 and T02) and a single copy non-rearranged genomic region (RNAse P) were designed to measure ctDNA and total cell-free DNA levels, respectively. ctDNA levels are plotted as relative amplifiable copies/ml of plasma. The horizontal dashed line indicates ctDNA detection limit. CEA levels in μg/ml are plotted as solid bars.