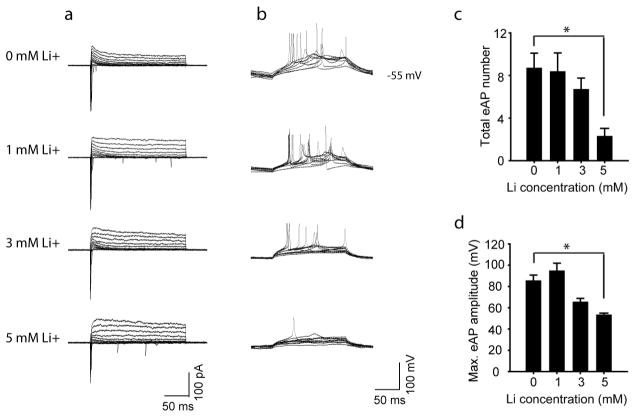
Extended Data Figure 7. Effect of Li on the normal neurons.
a, Representative traces of Na+/K+ currents in the normal neurons treated with Li at different concentrations. b, Representative traces of APs evoked during 300 ms stepwise depolarization periods in the normal neurons treated with Li at different concentrations. c, d, Bar graphs summarizing the effects of different concentrations of Li on the total number (c) and maximal amplitude (d) of evoked APs in the normal neurons (n = 4 neurons). Student’s t-test. *P < 0.05. Bars, mean ±s.e.m.

