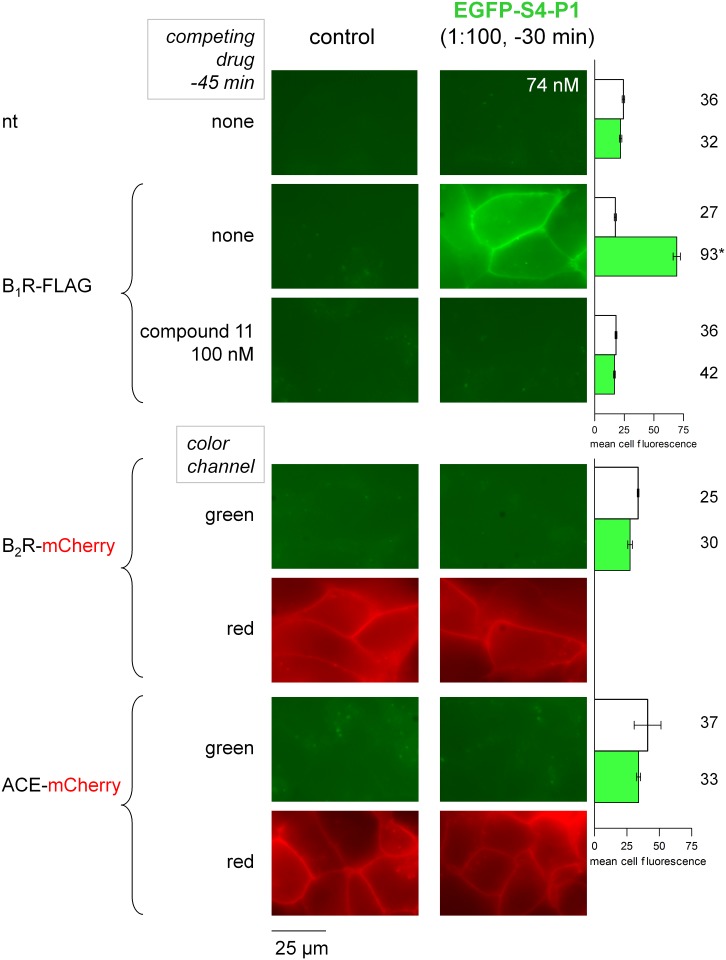
Fig 6. Characterization of EGFP-S4-P1 labeling of molecular targets related to the kallikrein-kinin system expressed in HEK 293a cells.
Top: competition of labeling by co-treatment with the non-peptide B1R antagonist coumpound 11. In this set of experiments, the 1:200 dilution of the producer cell lysate also produced a good labeling of B1R-FLAG, but the staining was weak with the 1:1000 dilution (data not shown). Top right: white histograms represent the averaged cellular fluorescence intensities of cells incubated without ligand, whereas green histograms were from EGFP-S4-P1 cells. ANOVA indicated that the mean cellular fluorescence intensities were heterogeneous (P<10−4). * Value different from all 5 others (P<0.001, Tukey-Kramer multiple comparison test), whereas all other pairs of values were not significantly different between them. Bottom: Lack of binding to other molecular targets related to the kallikrein-kinin system. Human B2R and ACE were fused to the mCherry FP; each construction was validated by the binding of its cognate radioligand. The red fluorescence allowed the visual confirmation of expression at the plasma membrane. Representative results of multiple microscopic fields. Bottom right: ANOVA indicated that the mean cellular fluorescence intensities were homogeneous (P = 0.48).

