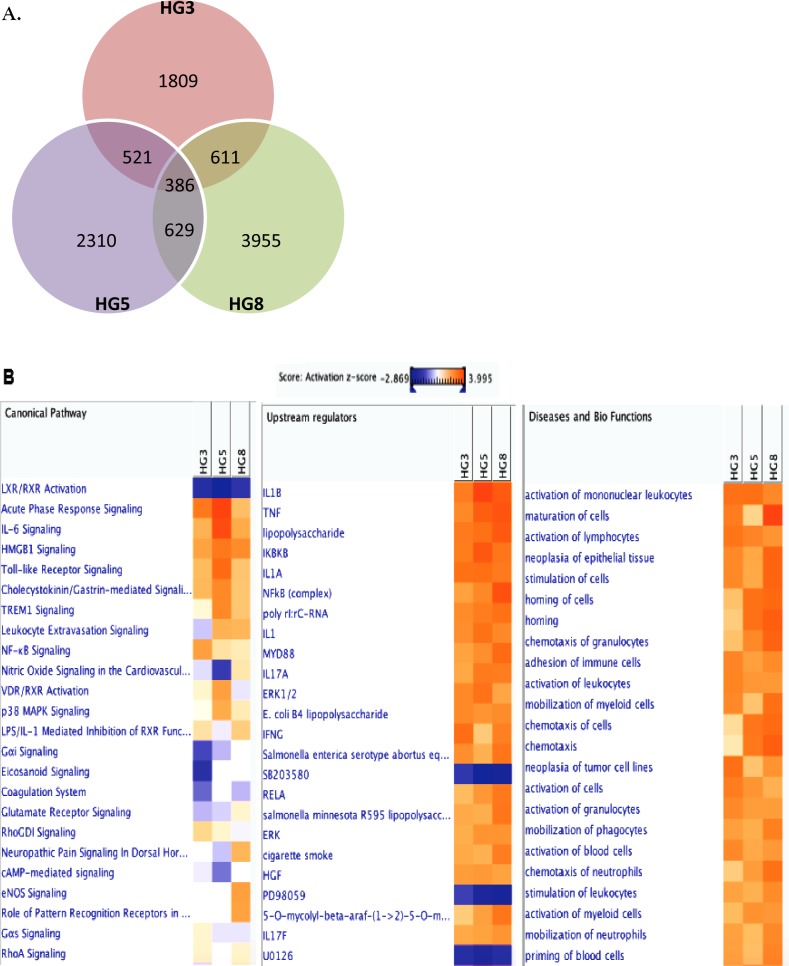
Figure 3. Transcriptome analysis of VZV-infected HGPS cells.
RNA-seq analysis was performed with RNA isolated from cells derived from HG3, HG5, and HG8 cultures that were infected with mock or VZV. (A) Venn diagram indicates the number of significant (>2-fold upregulation, FDR, 0.05) DEGs across three key comparisons (HG3, HG8, HG8) and the overlap between each set of genes. (B) Ingenuity Pathway Analysis (IPA) tool was used to generate the list of highest activated networks and genes with their respective scores obtained from IPA and categorized as canonical pathways, upstream regulators and diseases and biofunctions. Networks and genes shaded orange were upregulated, while those in blue were downregulated. Shading intensity indicates the degree that each gene was upregulated or downregulated. Range of activation z-score is also depicted on the figure.

