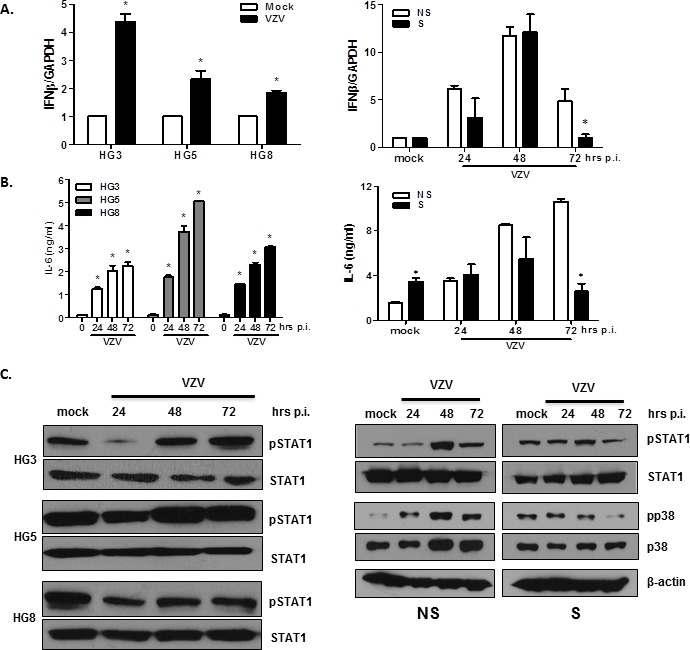
Figure 7. Validation of DEGs in VZV-infected non-senescent and senescent cells that are involved in antiviral responses and inflammation.

HGPS cells and NHDFs were infected with VZV at an MOI of 0.001 for indicated timepoints (0, 24, 48, and 72 hpi). (A) RNA was extracted and cDNA was made to perform qPCR. Host IFN-β mRNA expression levels were determined by qPCR. Expression levels were normalized to GAPDH. Mock-infected cells were arbitrarily set to 1. We performed qPCR assays in duplicate, with the mean ± SD from all experiments shown. *p < 0.05 vs. mock-infected cells (HGPS) and NS cells (NHDFs). (B) The concentration of secreted IL-6 in culture supernatants from HGPS cells and NHDFs was determined using enzyme-linked immunosorbent assays (ELISAs). Values presented are the averages from all experiments, with error bars representing SDs. *p < 0.05 vs. mock-infected cells (HGPS) and NS cells (NHDFs). (C) Cells were lysed and cell extracts were separated by SDS-PAGE and blotted onto nitrocellulose membranes. Protein levels of phosphorylated/total STAT1, and phosphorylated/total p38 MAPK were analyzed by western blotting. Anti- β-actin monoclonal antibody was used as a loading control. The images shown are representative of three independent experiments.
