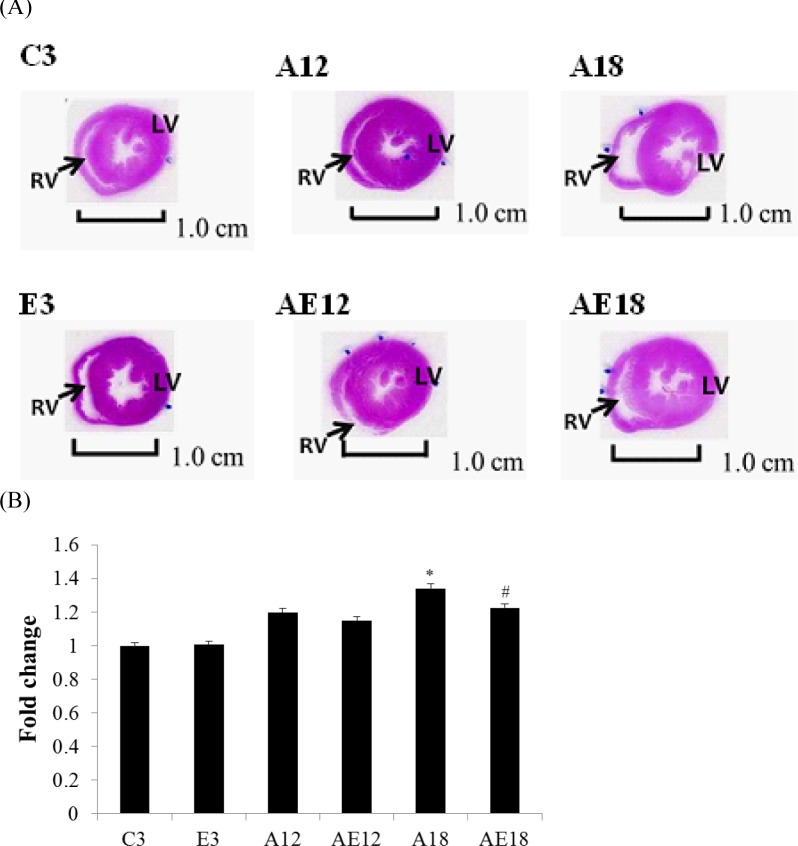
Figure 2. Hematoxylin and eosin staining.
Cardiac tissue sections stained with hematoxylin and eosin. (A) The myocardial architecture images were magnified ×10. The scale bar is 1 cm. RV: right ventricle, LV: left ventricle. (B) Quantization of cardiac ventricular area. *=P < 0.05, **=P < 0.01, *** =P < 0.001 compared with the age control group (C3 group); #=P < 0.05, ##=P < 0.01, ### =P < 0.001 compared with the indicated groups without exercise training.

