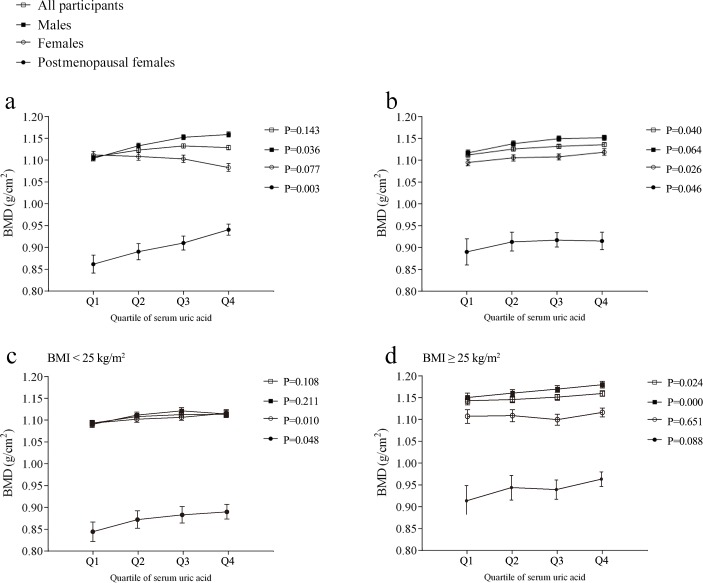
Figure 2. Bone mineral density (BMD) in each quartile of serum uric acid (Q1, Q2, Q3, and Q4).
a. Unadjusted BMD. b. BMD adjusted for age; height; weight; systolic blood pressure; levels of total protein, serum calcium, serum phosphorus, alkaline phosphatase, blood glucose, and blood lipids; and liver function. c. Adjusted BMD in the body mass index (BMI) < 25 group. d. Adjusted BMD in the BMI ≥ 25 group. Results are presented as the survey weighted least-square means and 95% confidence intervals from regression analysis. P-values are from the test for a linear trend across the serum uric acid quartiles.

