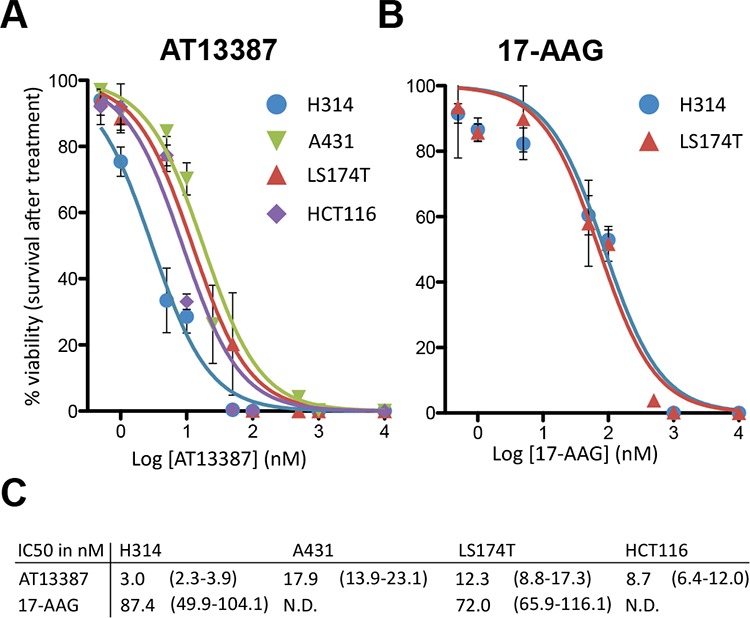
Figure 1. Dose response curves and IC50 analysis.

A. AT13387 treatment on H314, LS174T, A431 and HCT116 cells and B. 17-AAG treatment on H314 and LS174T cells. 7–21 days after drug exposure, colonies of more than 50 cells were counted. The error bars represent the standard deviation (n ≥ 4–8). C. Summary of the IC50 values (in nM) of the investigated cell lines with 95% confidence interval in parenthesis.
