
Figure 2. Clonogenic survival assays.
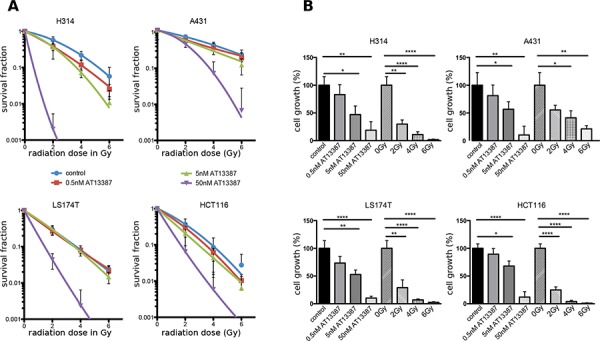
A. Dose response curves of H314, A431 LS174T, HCT116 and cells treated with AT13387 (0.5, 5, 50 nM) and radiation (2, 4 and 6 Gy). The cells were pre-plated in triplicates, incubated with AT13387 24 h later and irradiated 1 h after drug incubation. Colonies with > 50 cells were counted. The error bars represent the standard deviation (n ≥ 6–12). All curves are normalized to the plating efficiency of the non-irradiated controls. B. Effects of the AT13387 and radiation alone as measured by inhibition in cell growth (%) of the dataset in A), evaluated with Student's t-test with *p < 0.05, **p < 0.01, ***p < 0.001.