
Figure 4. DNA DSB rejoining capacity and migration distance and cell cycle analysis.
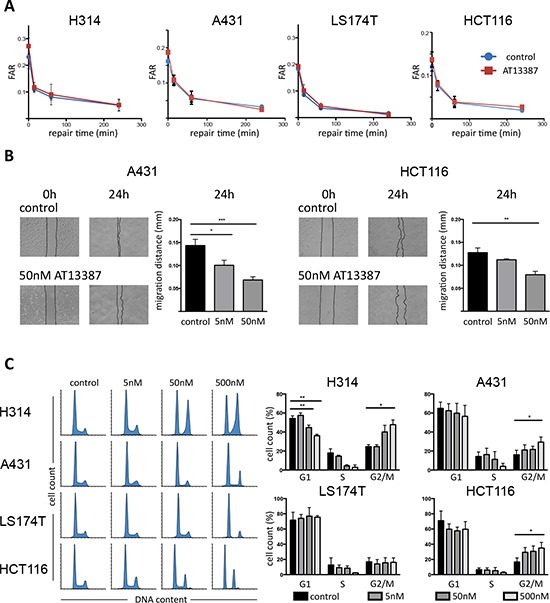
A. PFGE analysis. H314, A431, LS174T and HCT116 cells were exposed to 200 nM AT13387 for 24 h prior to irradiation. After irradiation, cells were allowed to repair. Kinetics of DSB end rejoining was calculated by fraction of activity released (FAR) corresponding to DNA of sizes < 5.7 Mbp. The error bars represent standard deviation, n = 4. B. Cell migration assay. Left hand images represent photographs of A431 and HCT116 cultures taken at 0 h (immediately after scratching) and at 24 h with and without AT13387 treatment. The graphs show quantification of the wounded area invaded after 24 h, measured in migrated distance in mm. The error bars represent standard deviation, n ≥ 3. Student's t-test was used to calculate statistics: *p < 0.05, **p < 0.01, ***p < 0.001. C. Flow cytometry evaluation of cell cycle progression. Left hand histograms show representative data of DNA content as stained by DAPI/PI indicating the progression from G1 through S and to G2/M phases. Increasing concentrations of AT13387 increases the G2/M peak and depletes the S phase. Right hand side shows quantification of flow cytometry data and statistical significance from ANOVA with Tukeys post-test.