
Figure 5. Effect of AT13387 treatment on HSP90 client protein levels (HSP90, ATM, DNA-PKcs, EGFR, AKT, CD44, CD44v6).
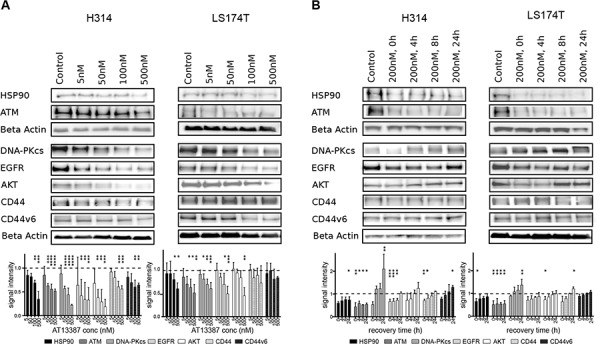
A. Dose-dependent downregulation of client proteins. H314 cells and LS1474T cells treated with the indicated doses of AT13387 for 24 h. B. Recurrence of protein level after AT13387 treatment. H314 and LS174T cells were treated with 200 nM AT13387 for 24 h. After drug treatment cells were kept in drug-free complete medium for 0, 4, 8 and 24 h. Lysates were harvested and equivalent amounts of protein from each lysate were resolved by SDS-PAGE and immunoblotting with the indicated antibodies. The expression levels of beta actin were used to ensure equal loading. Above: Representative Western blots, Below: Western blot quantification. Protein levels were normalized to beta actin, and were normalized to the level of untreated control (dashed line). One way-ANOVA with Bonferroni post-test was used to calculate statistics: *p < 0.05, **p < 0.01, ***p < 0.001, ****p < 0.0001. Error bars represent the standard deviation, n = 3–6.