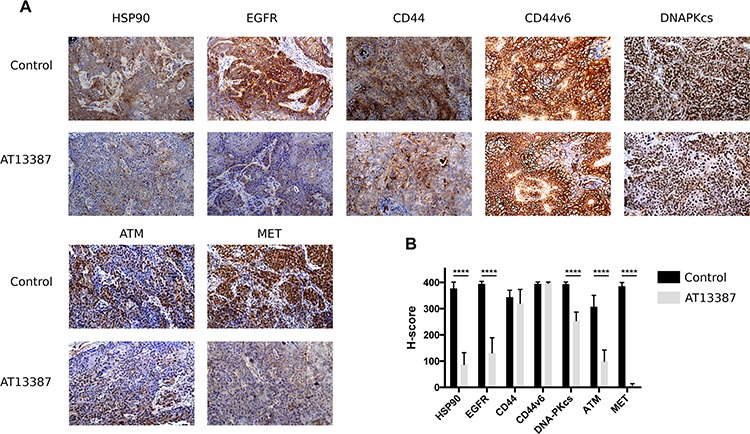
Figure 6. Immunohistochemical analysis on A431 tumors.

A. Representative images of ex vivo immunohistochemical staining for HSP90, EGFR, CD44, CD44v6, DNA-PKcs, ATM and MET expression in A431 tumor xenografts (magnification × 10). Mice in the treatment group (n = 6) received 5 doses of 50 mg/kg AT13387 on 5 consecutive days before dissection and analysis. The effect of AT13387 was highest on the expression pattern of HSP90, EGFR and MET. B. Semiquantitative analysis of immunostainings using the H-score method. Error bars represent the standard deviation, n = 16. One way-ANOVA with Bonferroni post-test was used to calculate statistics: *p < 0.05, **p < 0.01, ***p < 0.001, ****p < 0.0001.
